Simplifying Data Visualization in Schools
Company
Year
2020
Role
- Product Designer Pl.
Responsibilities
- UI Design
- UX
- Discoveries
- Data analysis
- Research
- Interviews
- Tests
Context
Early 2020 marked my entry into the B2B team of Descomplica, specifically the Descomplica for Schools project. It was a time of new beginnings for me and everyone else involved, as we embarked on an innovative journey brimming with potential.
With a dual focus, this business unit sought to diversify Descomplica’s revenue sources and simultaneously tackle issues within the school ecosystem, making a positive impact on all its users.

Business model
Descomplica offered an ecosystem of products that included: Recorded and live classes, Exercises, Lesson planning, Assessments, and Reports.
Schools were charged a monthly fee with an annually renewed contract, which gave us time to showcase our core value proposition: completely original content and high-quality teaching.
However, a latent pain point emerged from the Pedagogical Managers, which became a priority on the roadmap.
Como surgiu o problema
As a priority, the team decided to tackle one of the main pain points, recorded in 85% of customer support tickets. This pain point was related to customer purchase objections and was also observed in in-depth interviews that I had already participated in within the team.
Schools were losing students due to the pandemic and started to evaluate the product’s value proposition more closely, leading to an increase in churn.
Feedback received pointed to the superficiality of the data and the lack of actionable insights it provided. By listening to users for about two weeks, we were able to understand the extent to which it would be beneficial to delve deeper into specific data and what the decision-making process of the Manager was.
Their daily tasks included:
- Checking whether students were following the weekly study plan
- Following up with teachers and students’ guardians.

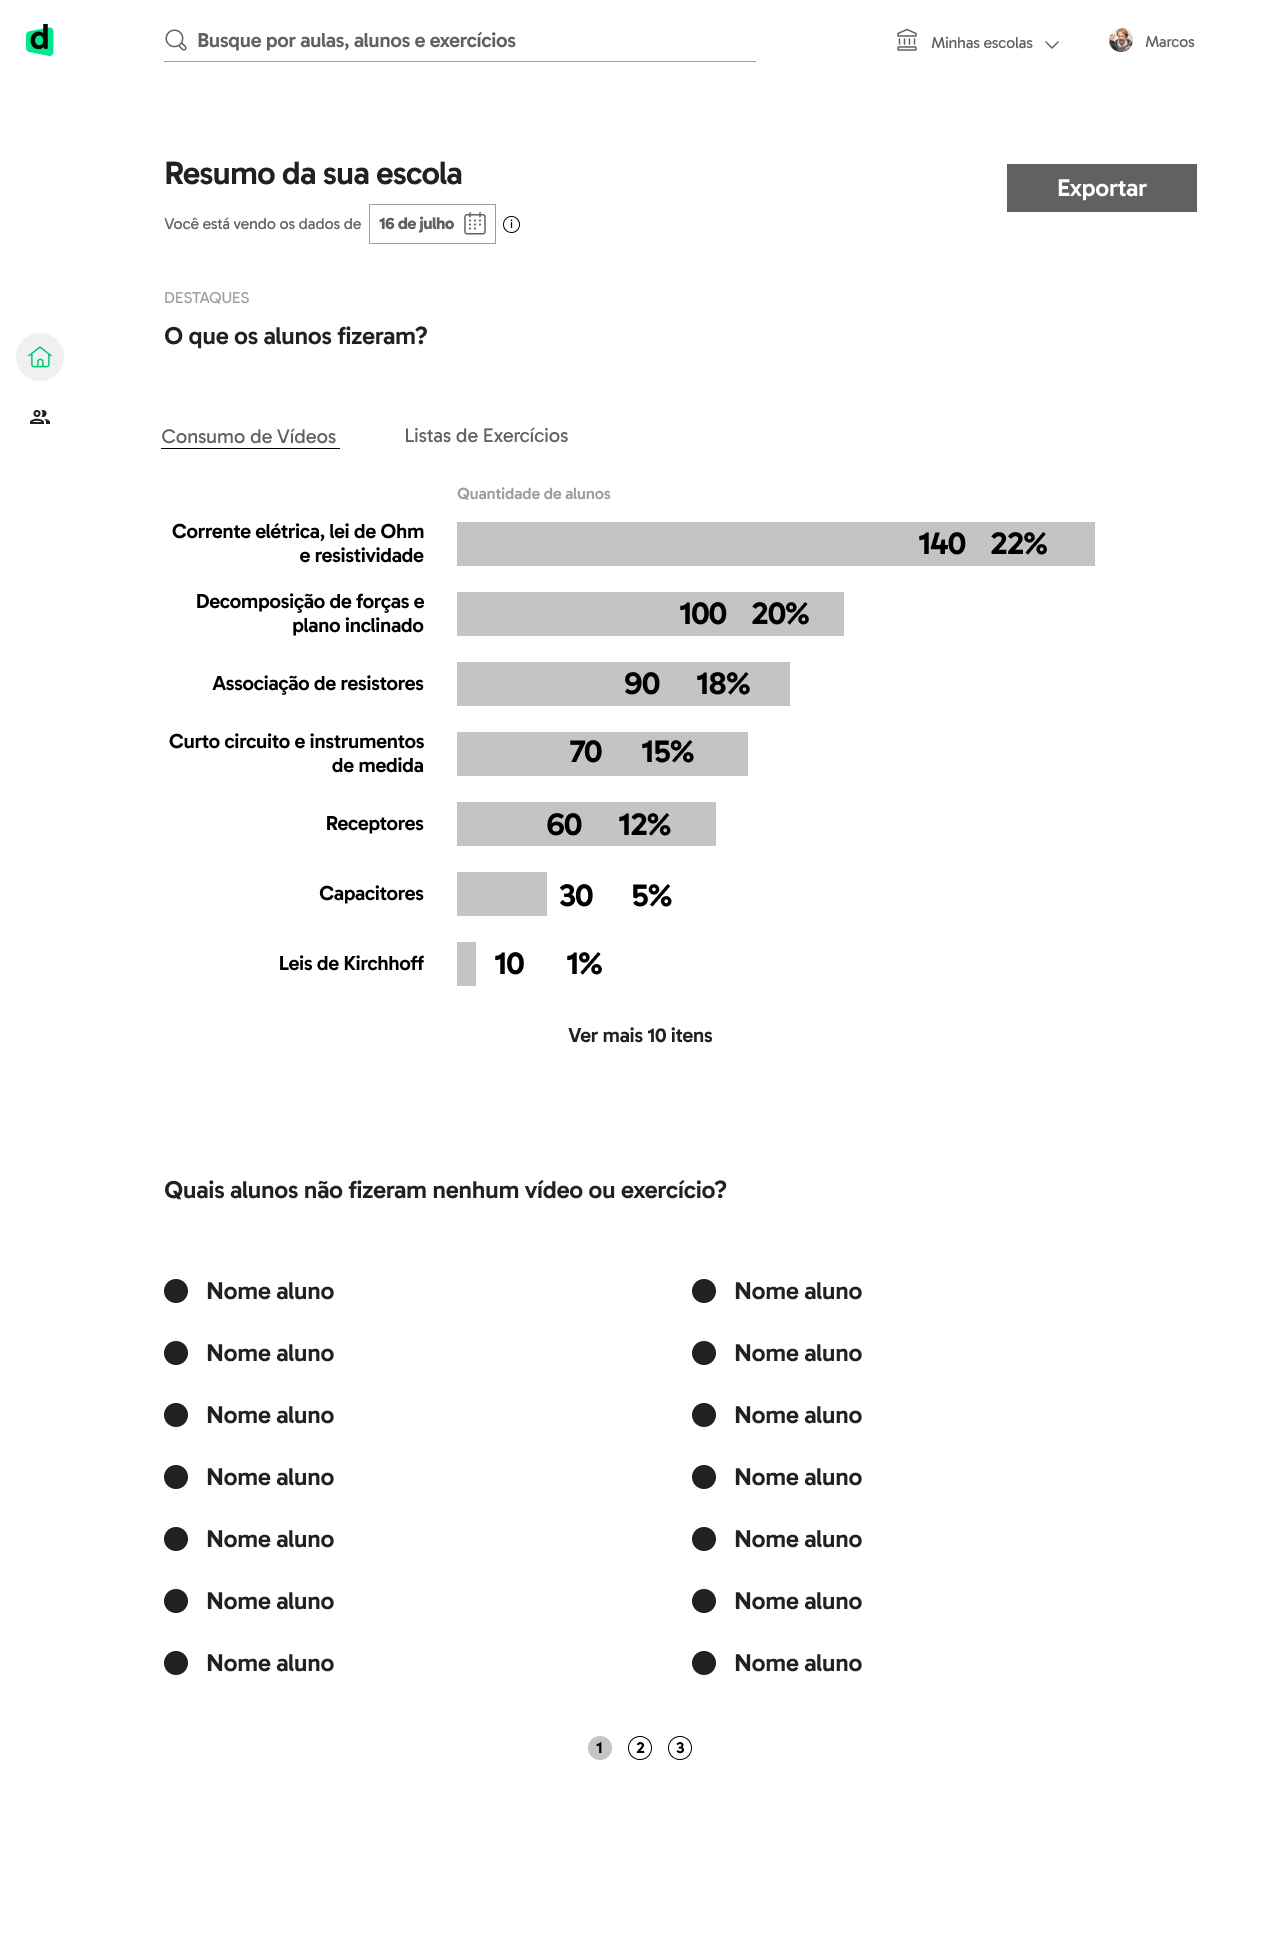
Version that the managers had access to, with superficial information.
Business' objective
There was an urgent need to deliver value to the market, both for strategic positioning against competitors and to reduce churn and gain the trust of these schools. Our goal was to make them realize the true value of our original educational content, which is considered the best in the market.
We then focused on addressing the need reported by the Pedagogical Managers, which had a significant weight in the decision-making process for tool selection and was the least served by our product.
How can we facilitate student data visualization for Pedagogical Managers?
What was the school ecosystem like?
After each interview to better understand where, how, when, and why the administrative manager visualized the data of their students, my project manager and I would gather to create a decision tree that generated the descriptions below and all their day-to-day objectives.
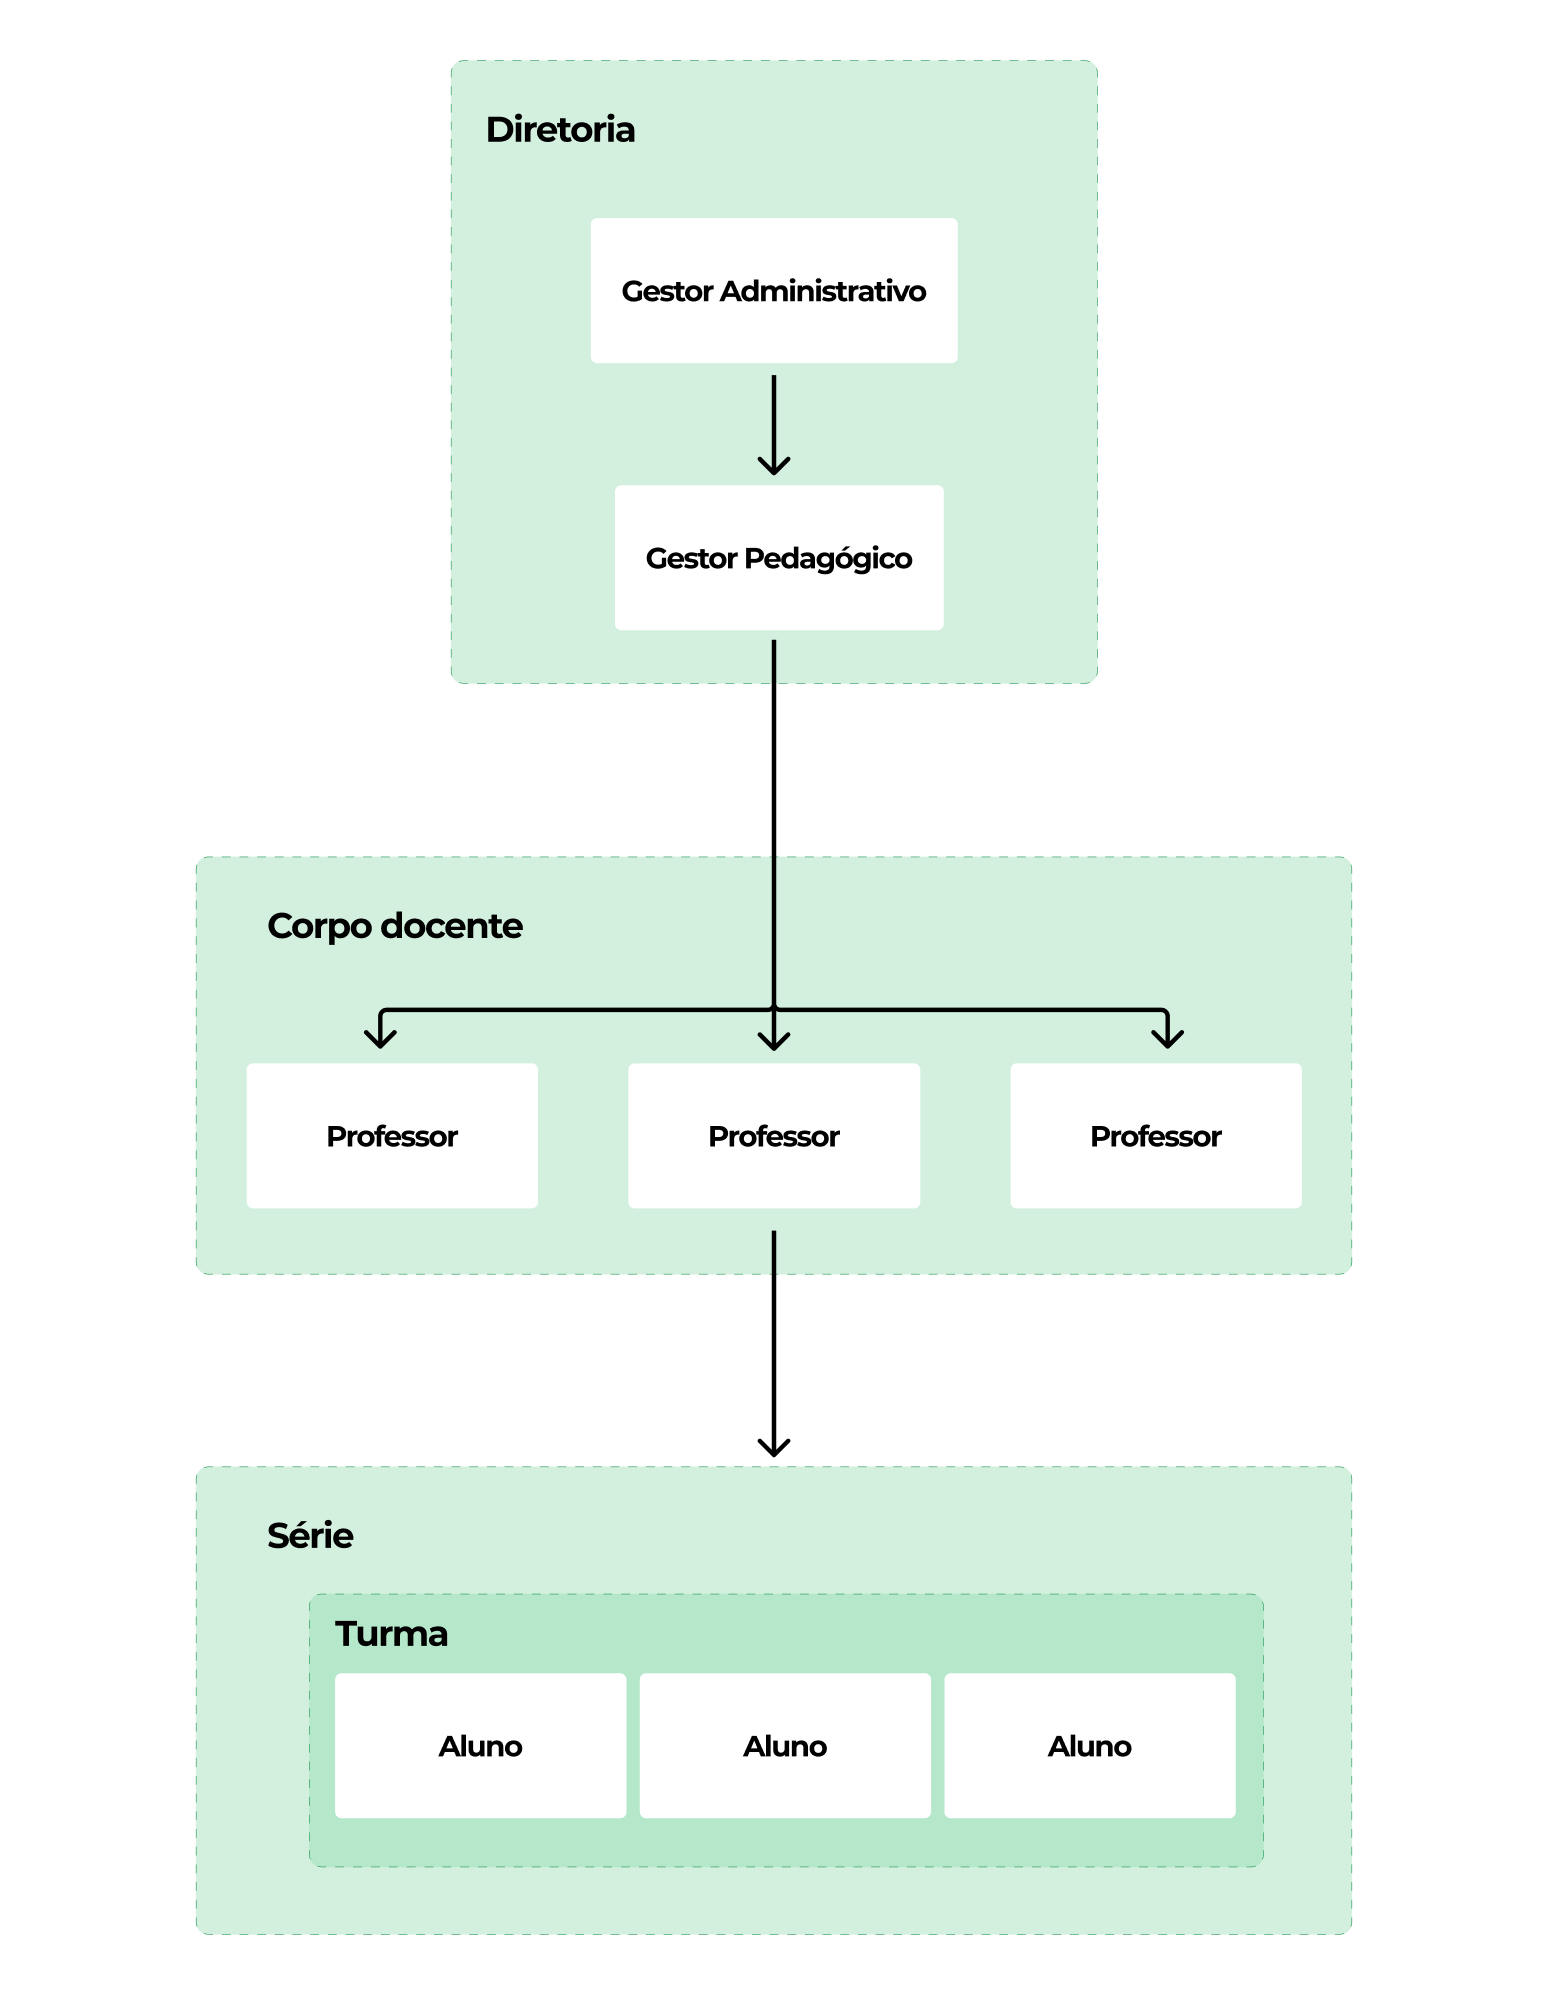
Professor
Teachers are the primary mediators between the administration and the students. They are the ones who earn the students’ trust and build intimacy to extract feelings, doubts, and questions. On a day-to-day basis, teachers are responsible for selecting content based on their class, aligning this with the Pedagogical Coordinator. Mediating this relationship, the teacher conveys the necessary content, provides class reports, and collaborates with the coordinator to determine what should be distributed and the next steps in response to the results of these reports.
Administrative manager
The administrative manager is dedicated to the contracts established with the school, the external relationship with the end buyers (parents), and the recruitment of students, along with all the resources involved in spending and acquiring students resulting from this process.
Pedagogical manager
The pedagogical manager is involved in materials purchased by the school, especially if they have an impact on its daily teaching activities. They are responsible for coordinating the planning and production of materials provided by teachers, ensuring that it is distributed to students on a weekly basis. Additionally, they ensure student attendance and that students are in a healthy learning environment.
Students
Students study based on the curriculum provided by the school, and online platforms serve as supplementary resources directed by the school’s coordination in their schedule or suggested by the teacher.
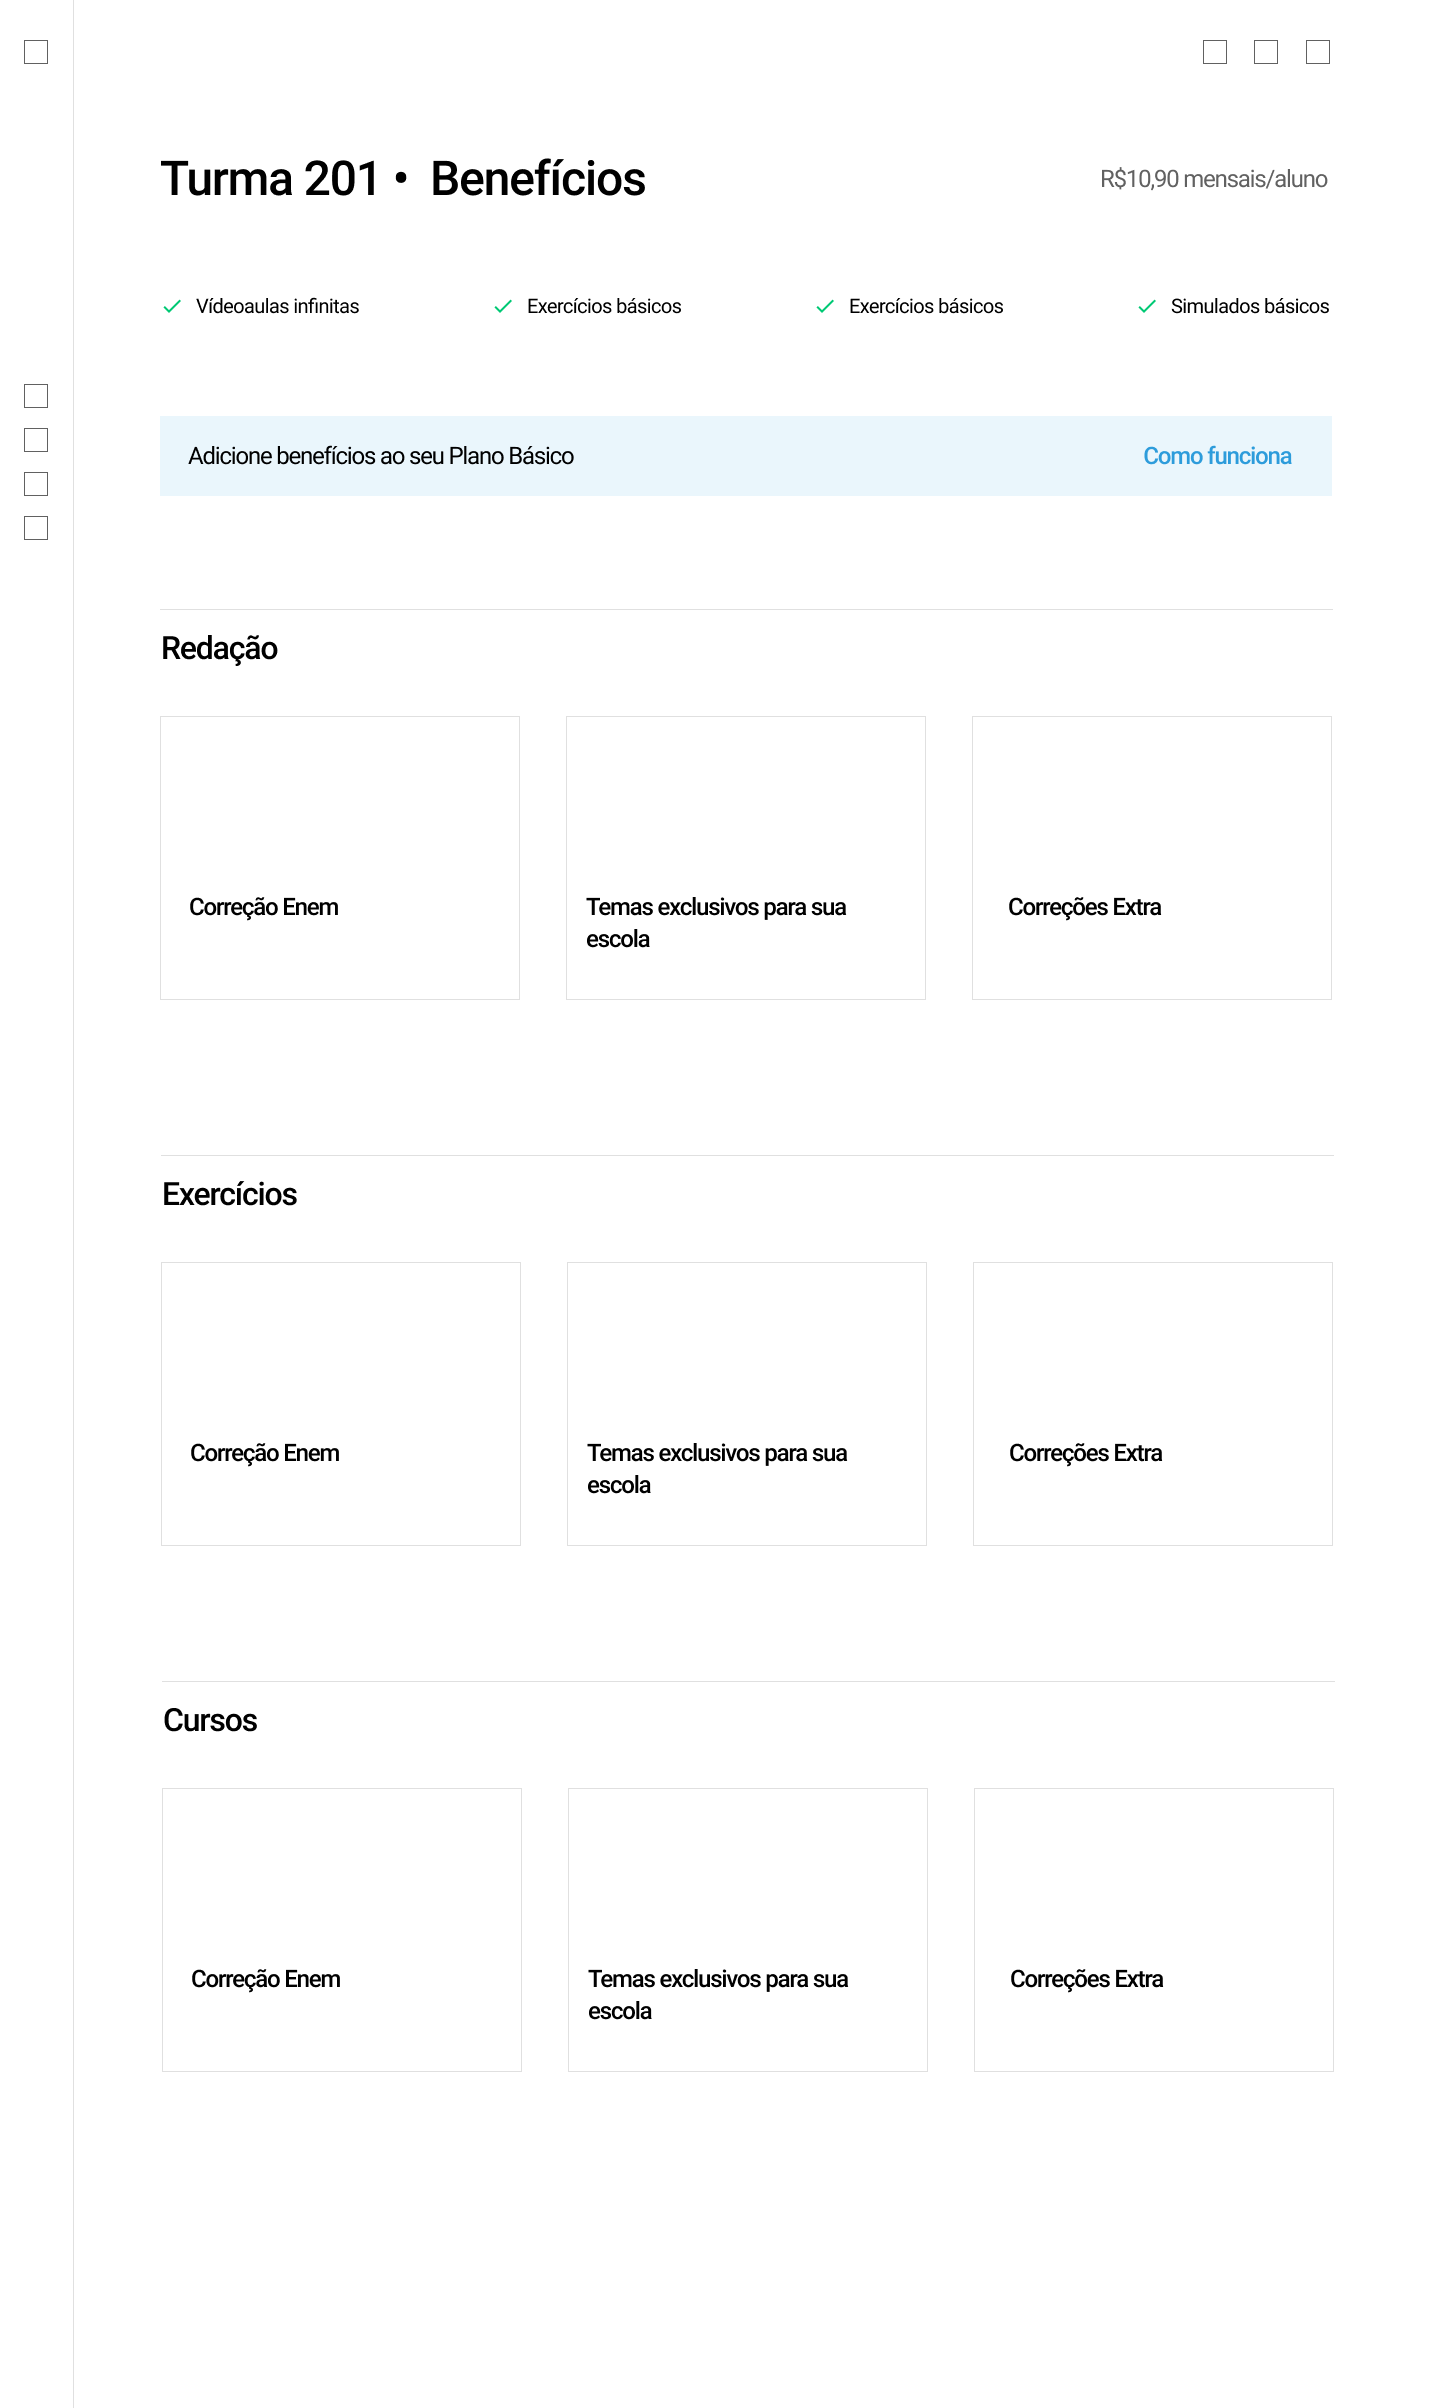
Benchmarks, drafts, and definition of information architecture
In parallel with the interviews, I needed to work on a draft around an architecture that encompassed this data visualization. To do this, I had a foundation where many feedbacks originated, which came from an initial version released to beta testers.


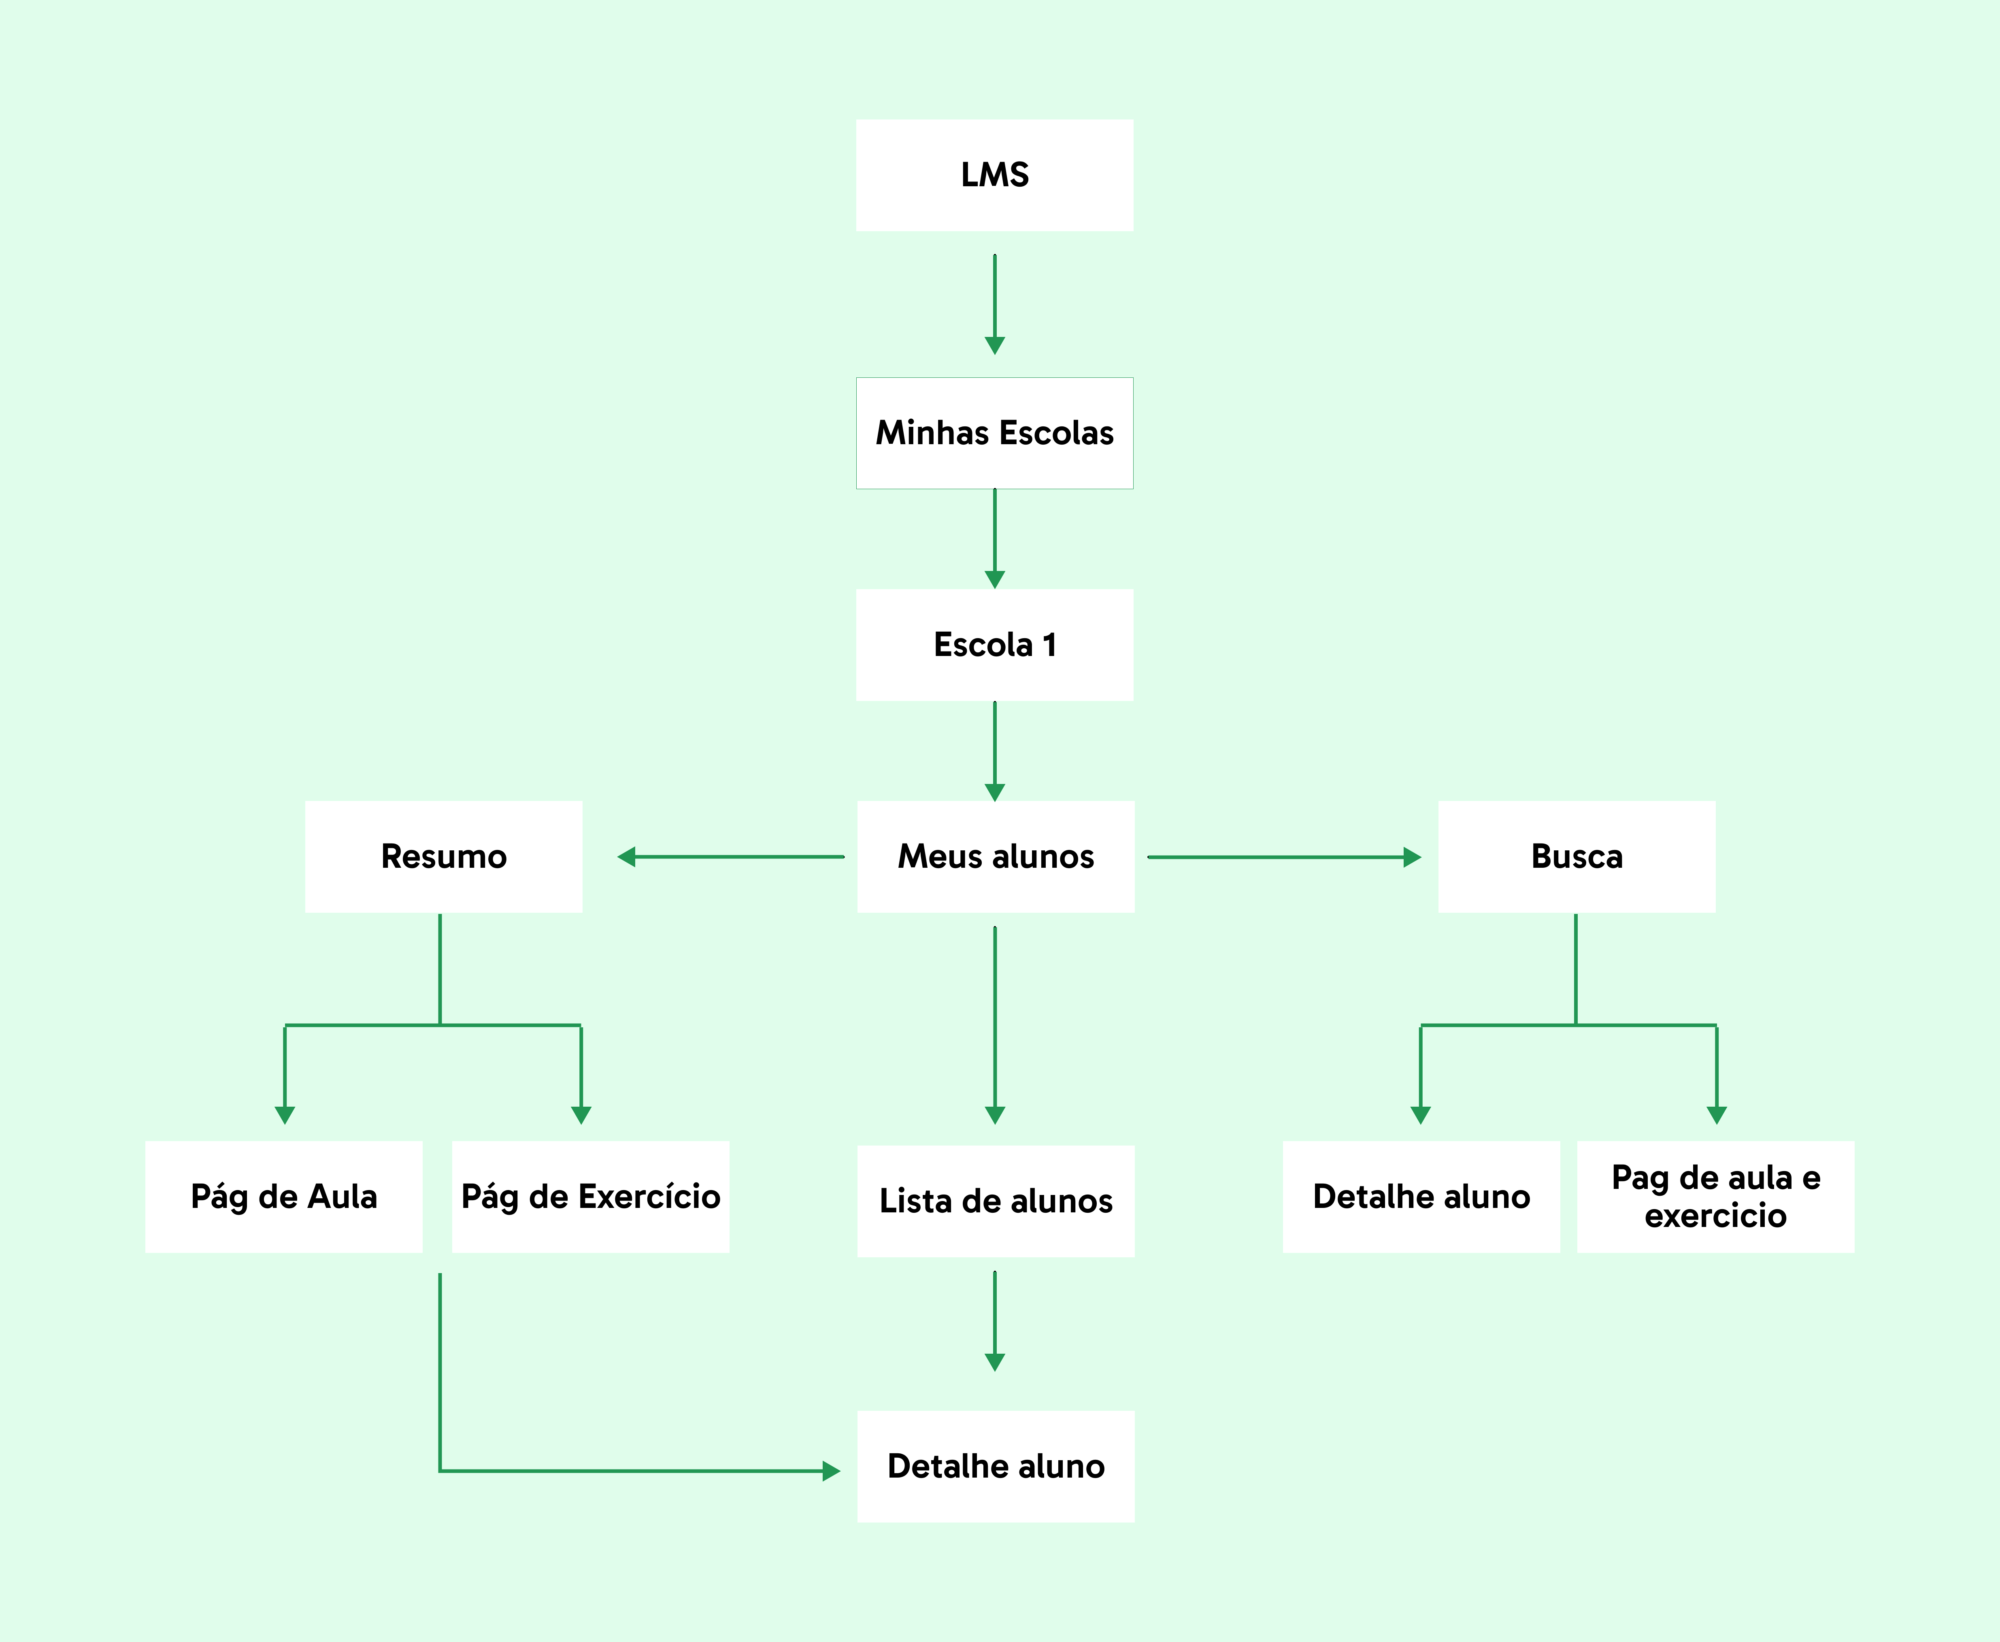
At this point, I had already defined the information architecture with the entire team and considered possible interactions on each page, as well as technical limitations for data consumption and presentation.
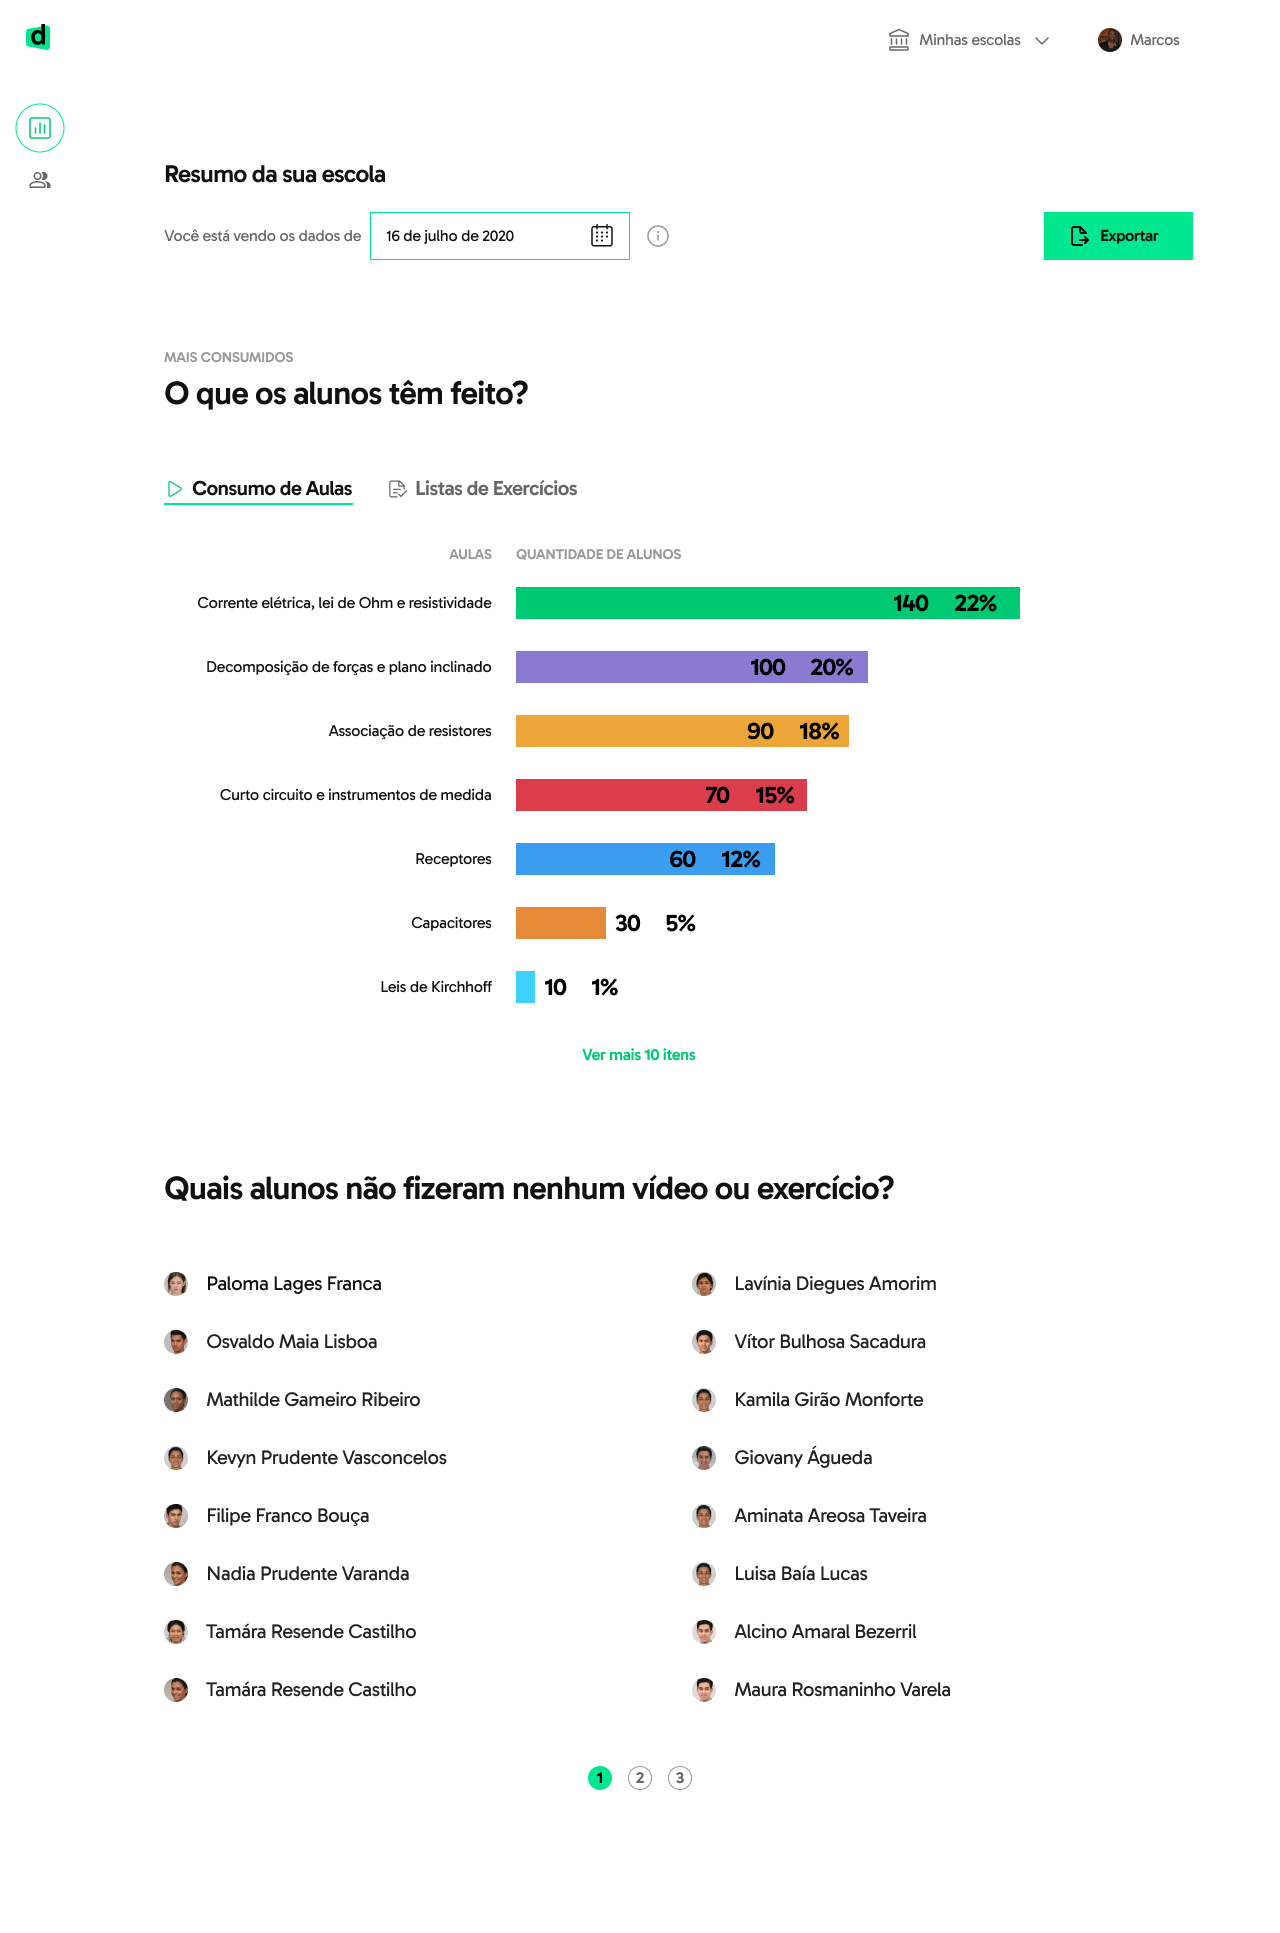
Our product would have the main interactions:
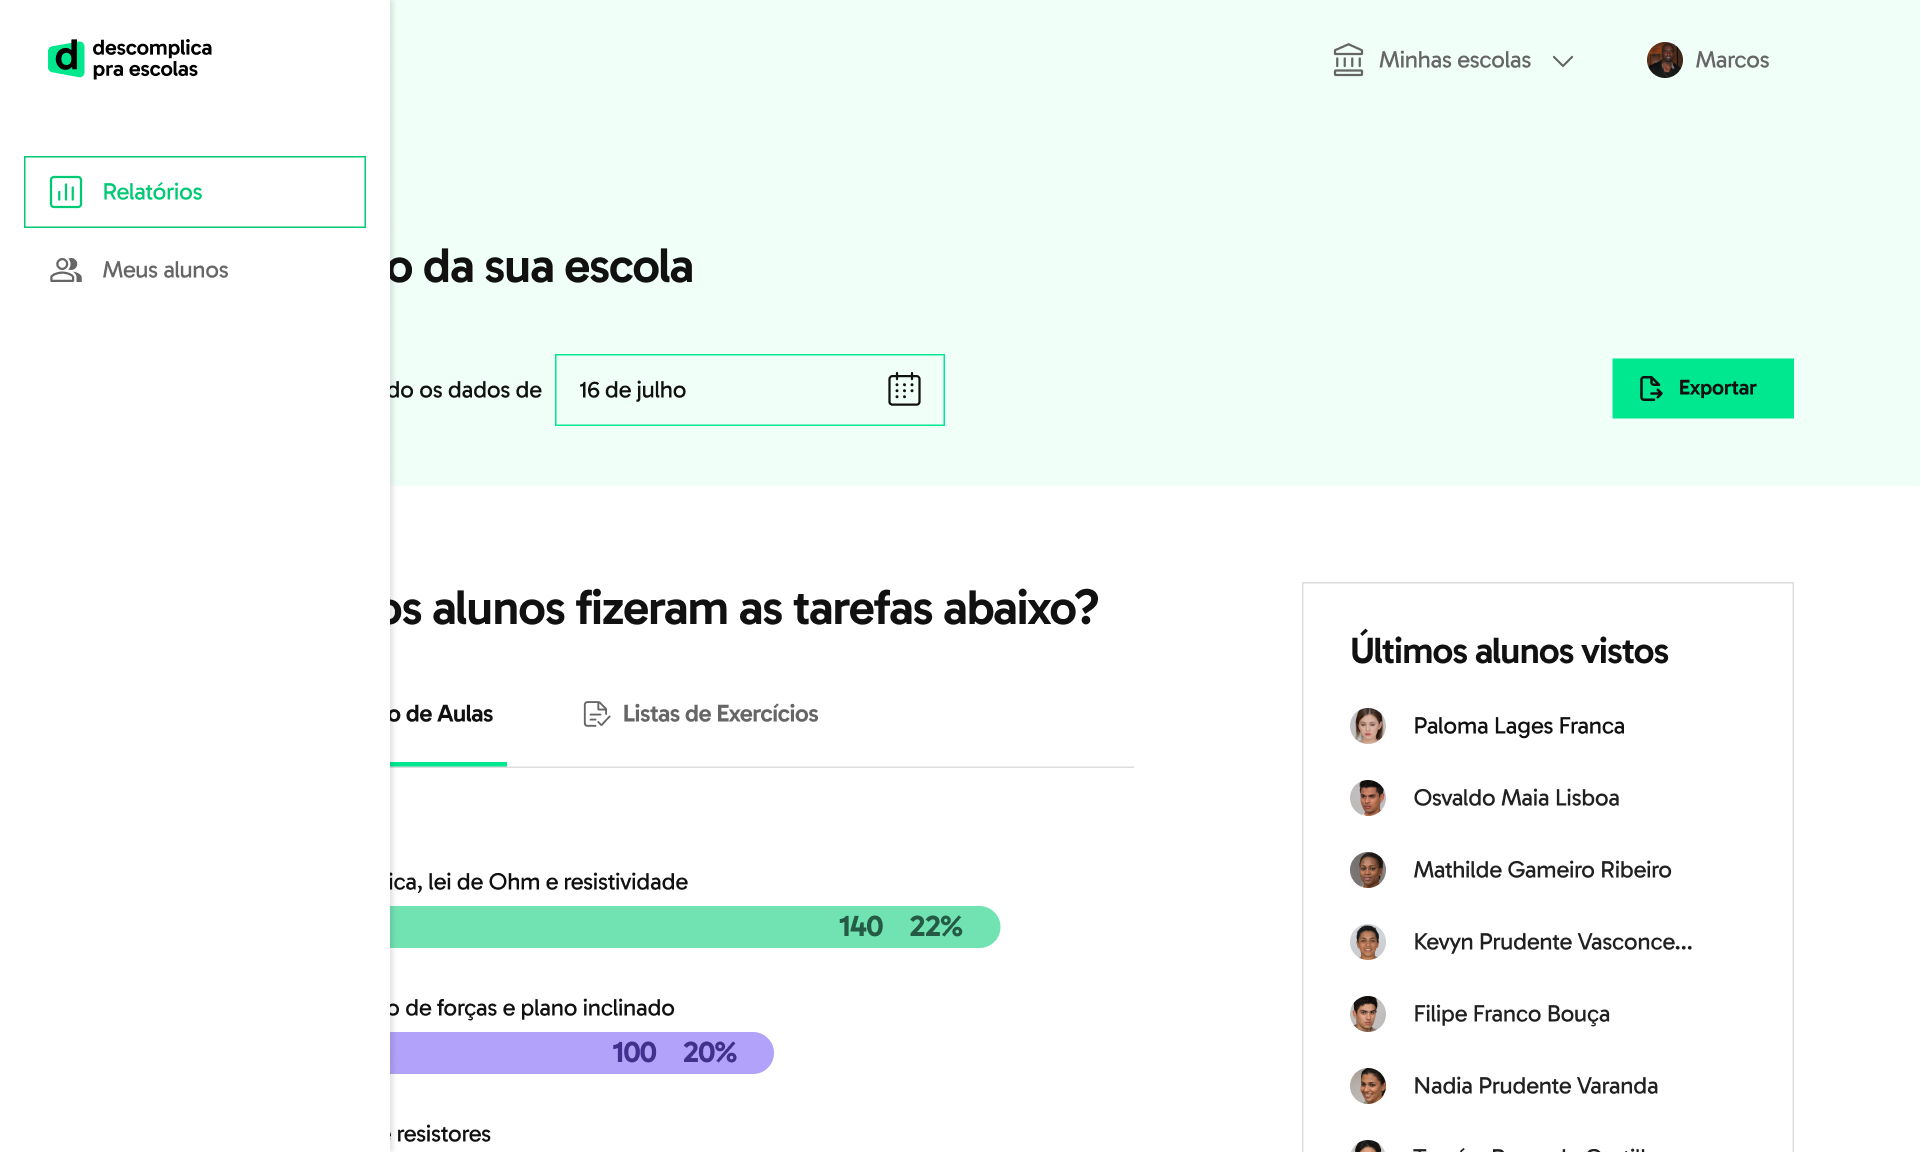
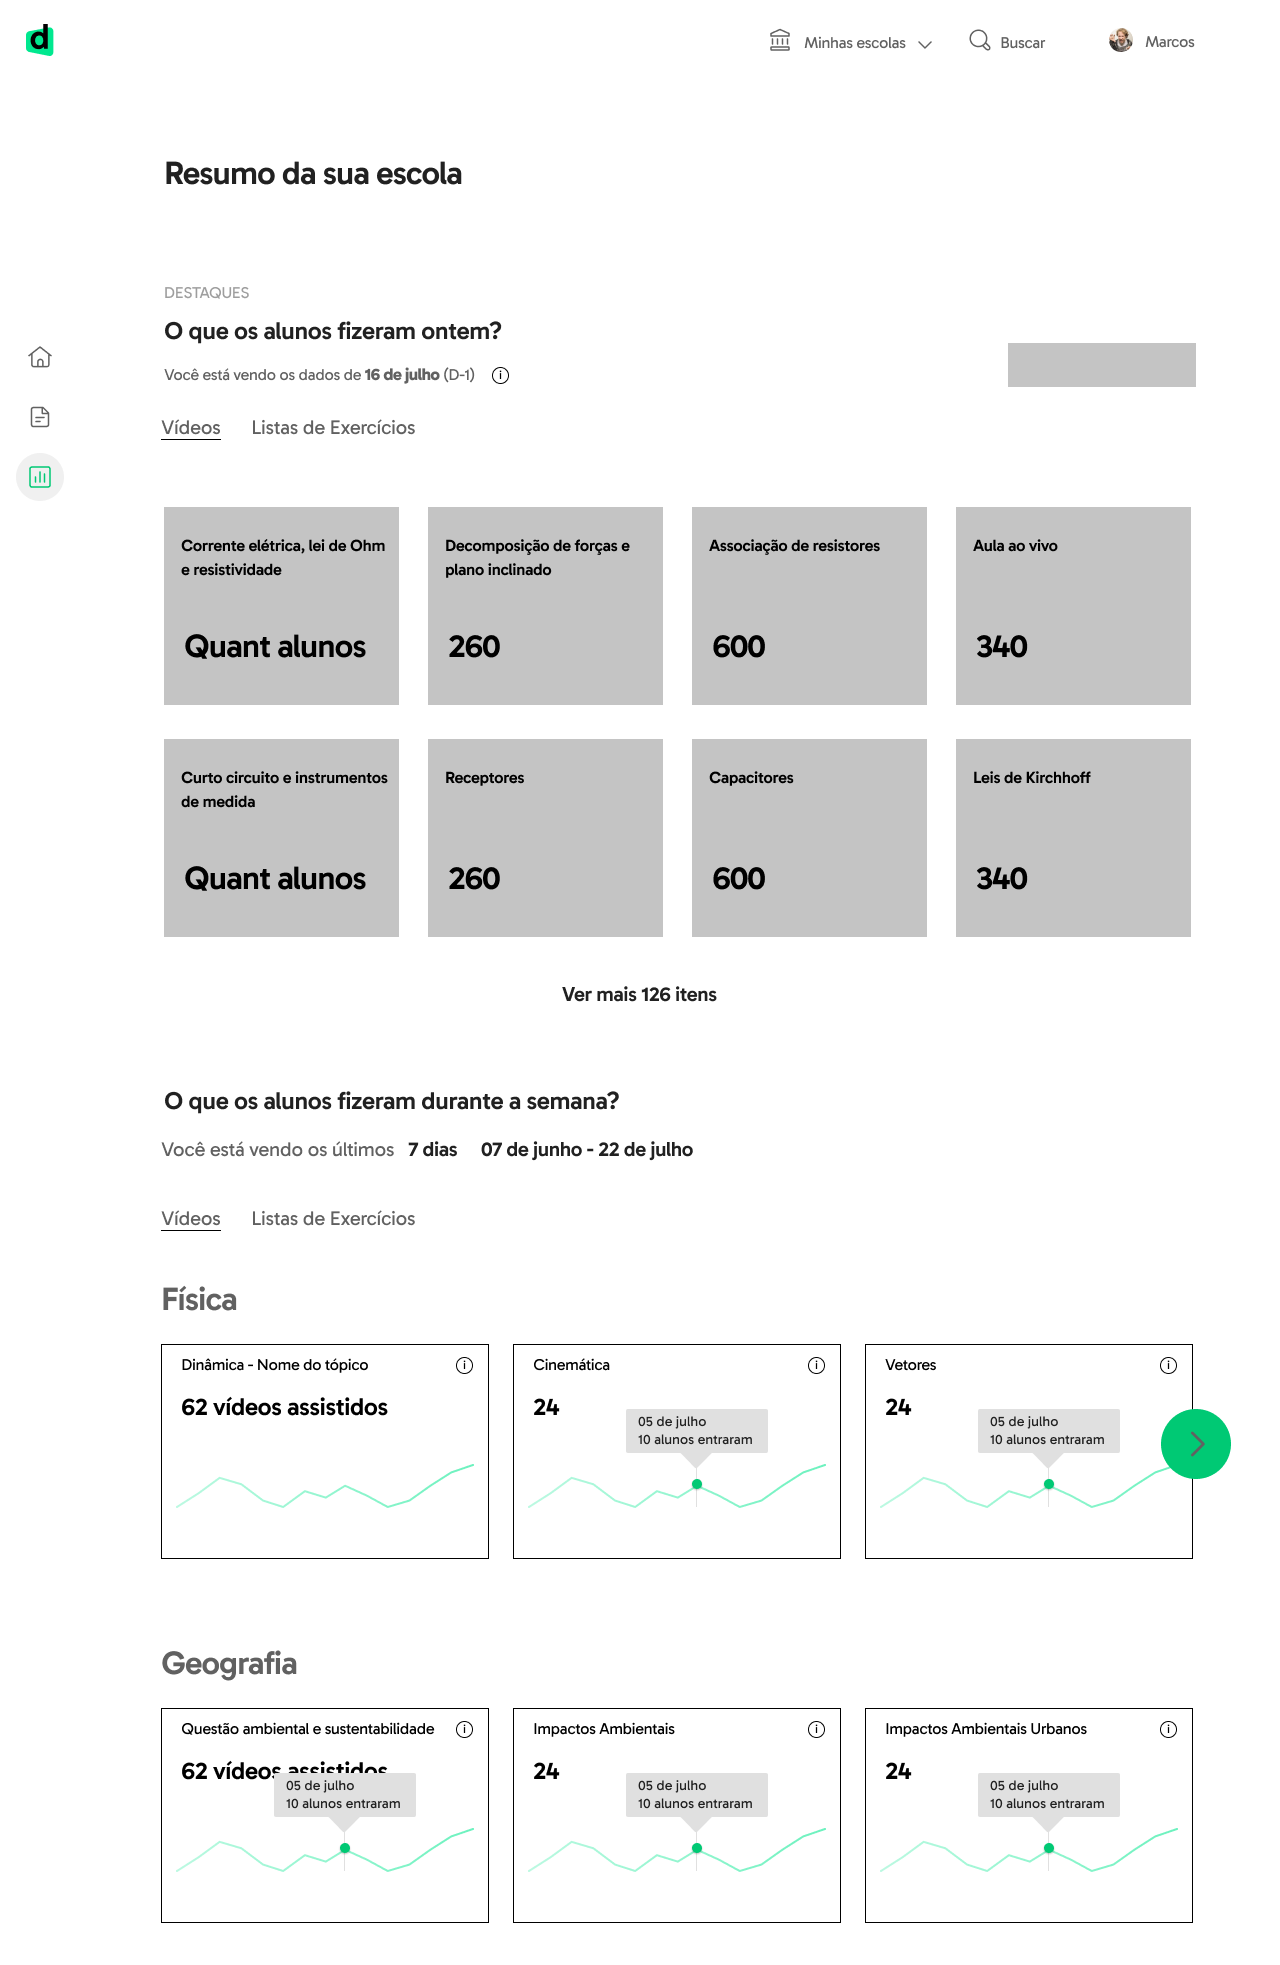
Viewing how many students watched recorded classes or completed exercises for a specific subject in 15 days
Allows for a macro-level consumption of information for all students in the school.
Observing the quantity of students who haven’t completed any planned tasks
Would enable quick access to students who may not be engaged.
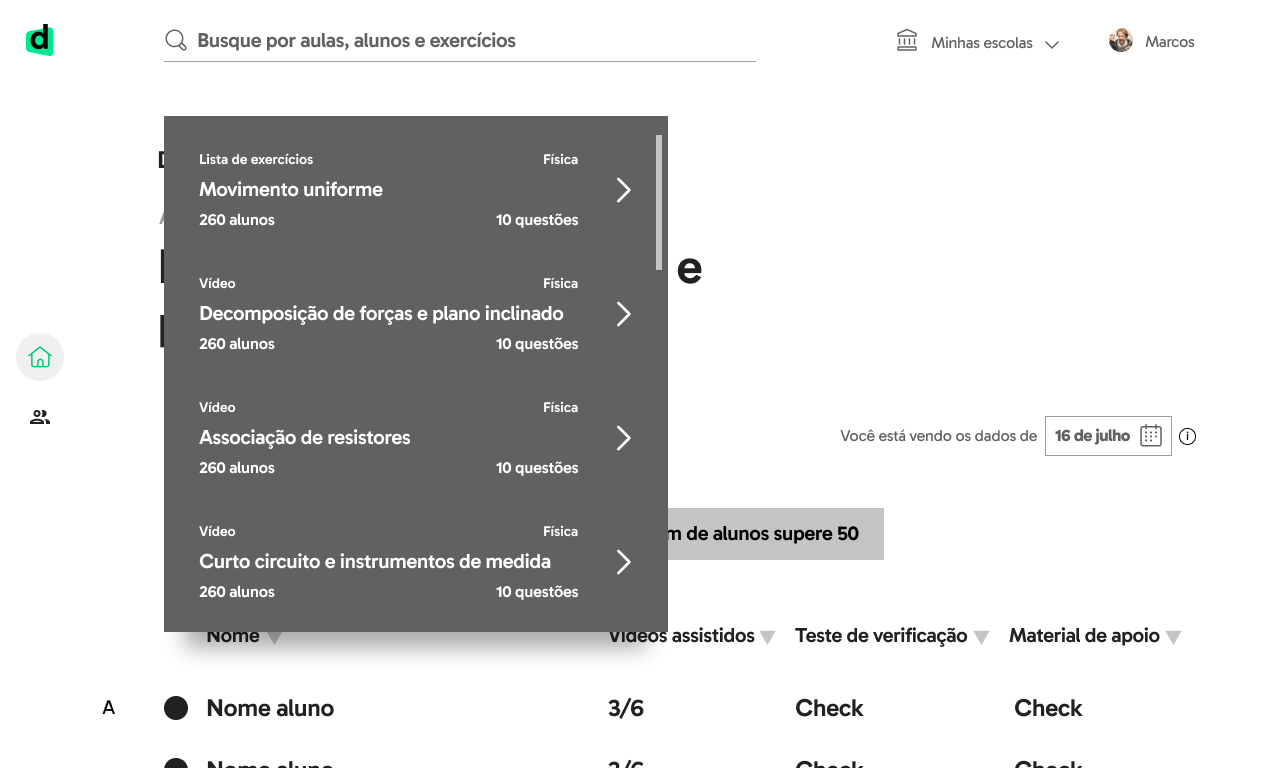
Having quick access to the list of students recently viewed by the user
This solution would address the specific control needs of certain students that the school may have.
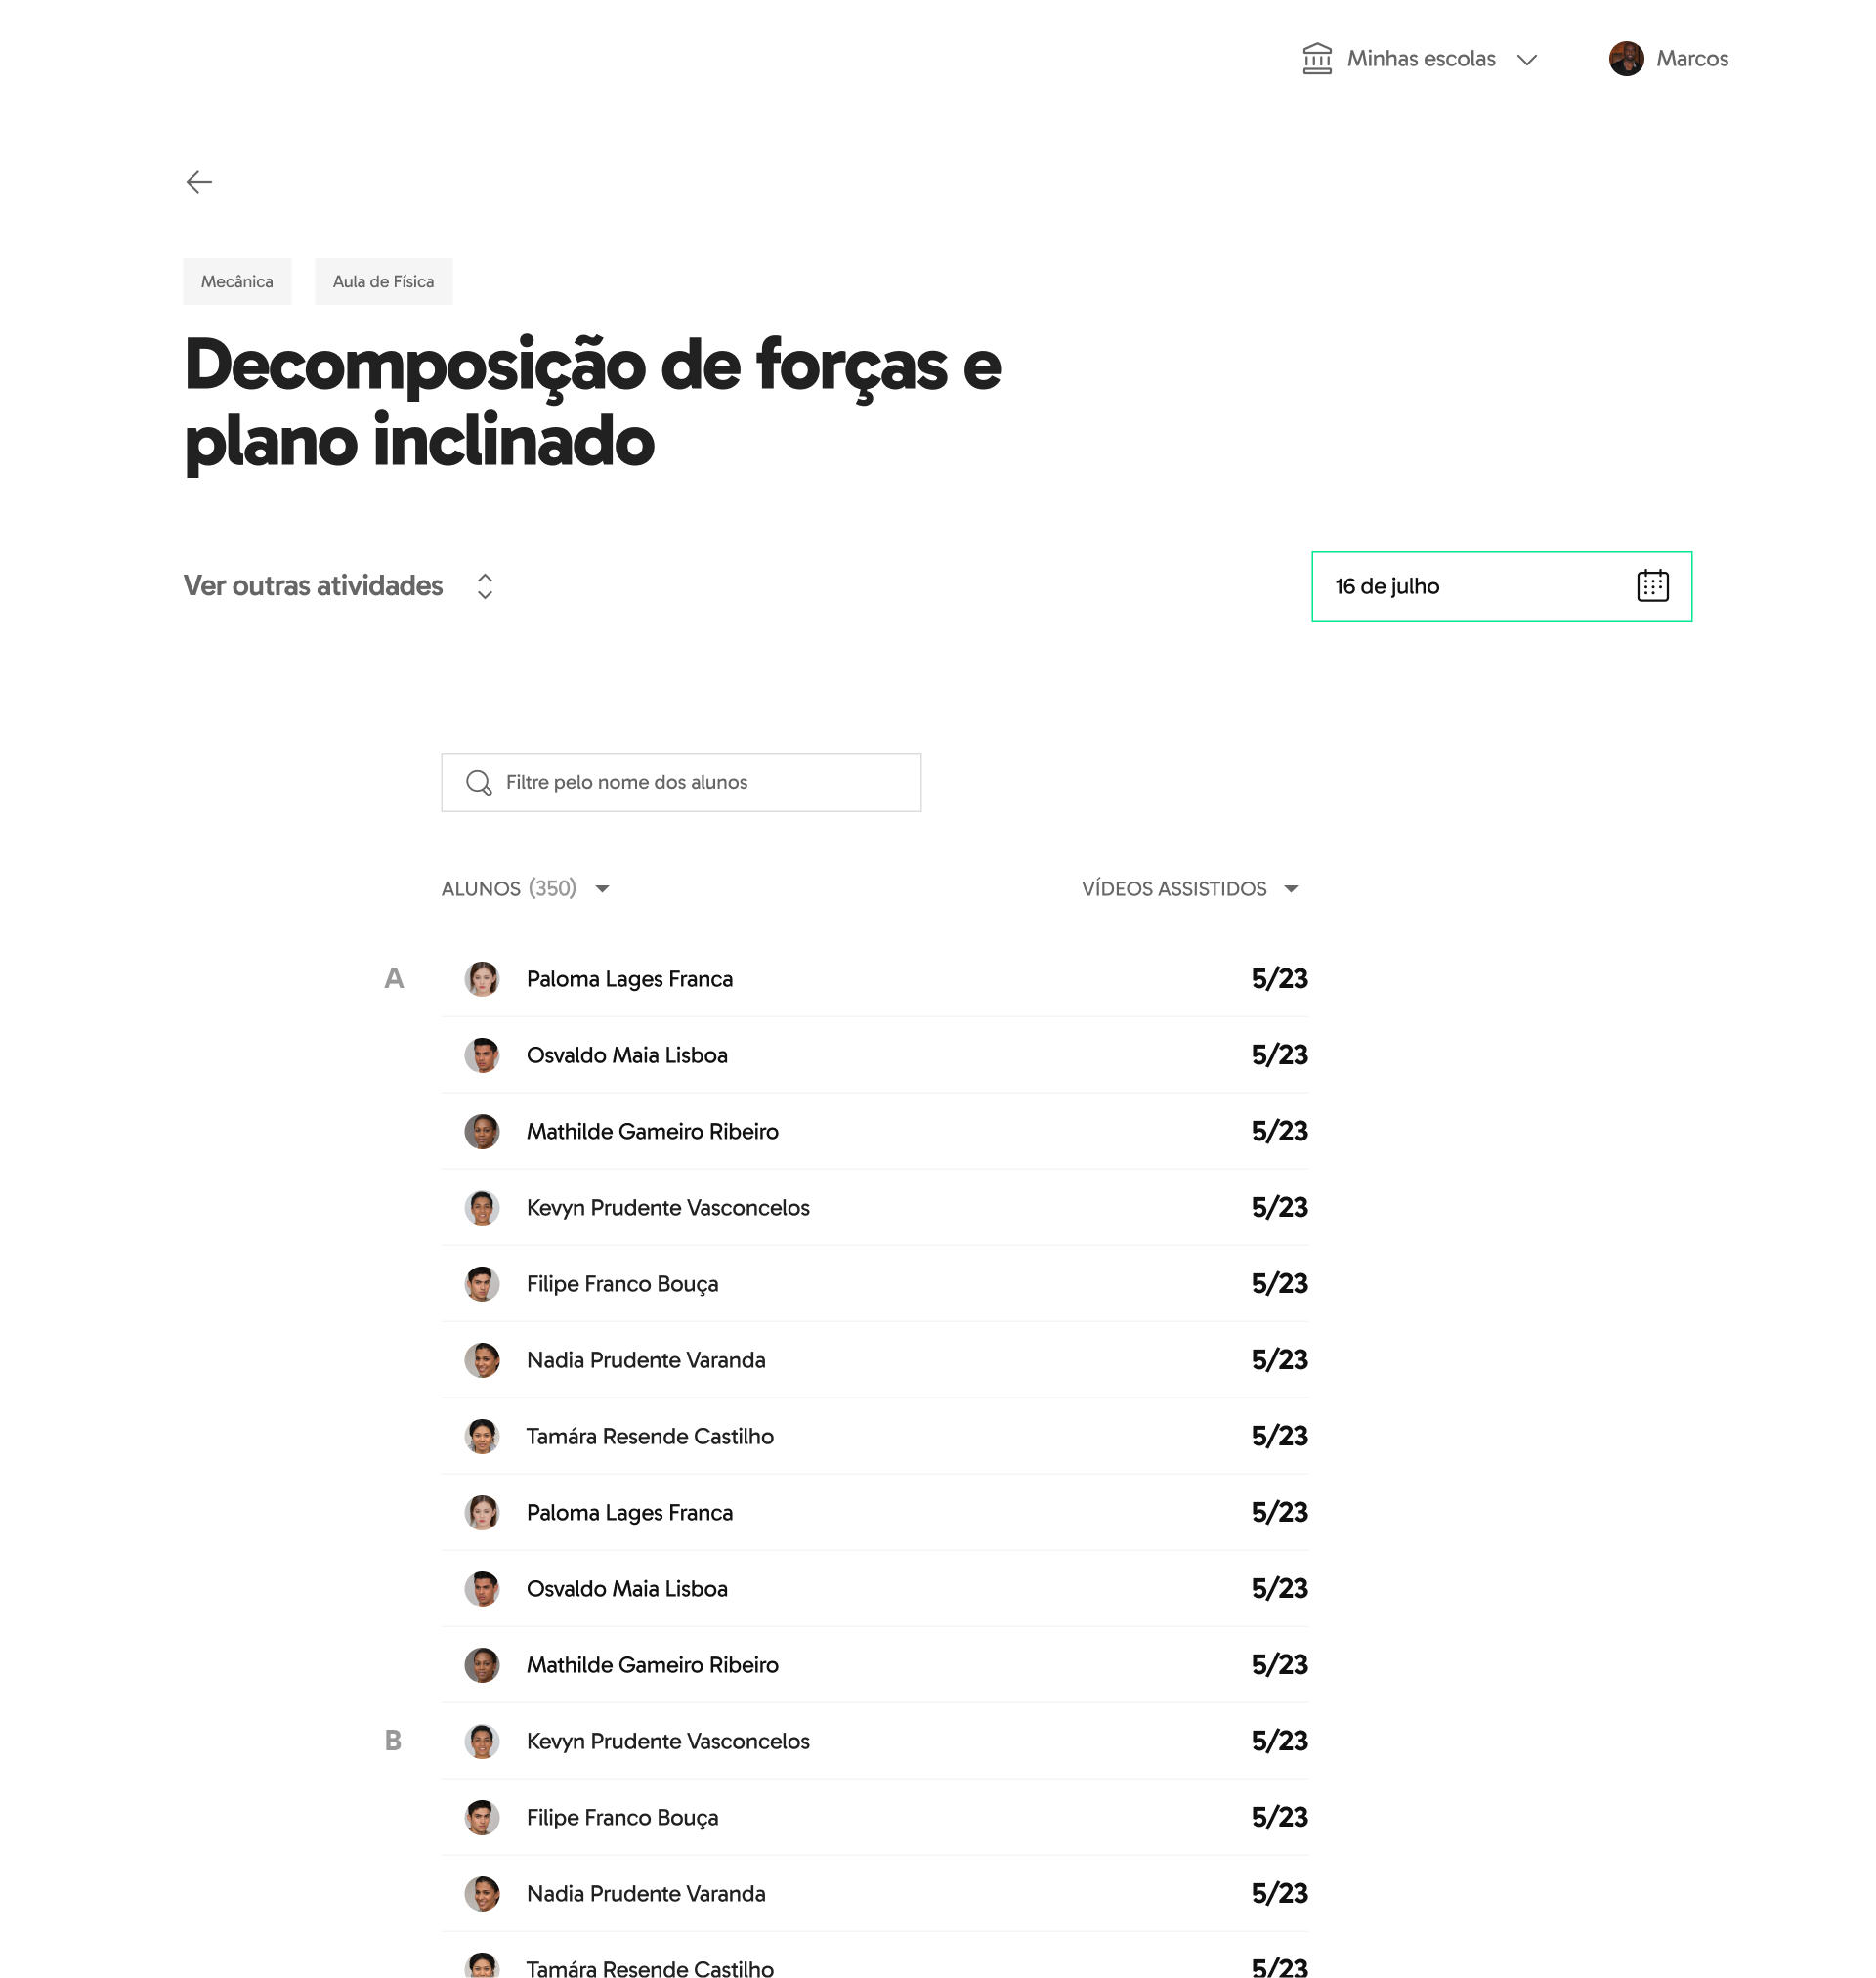
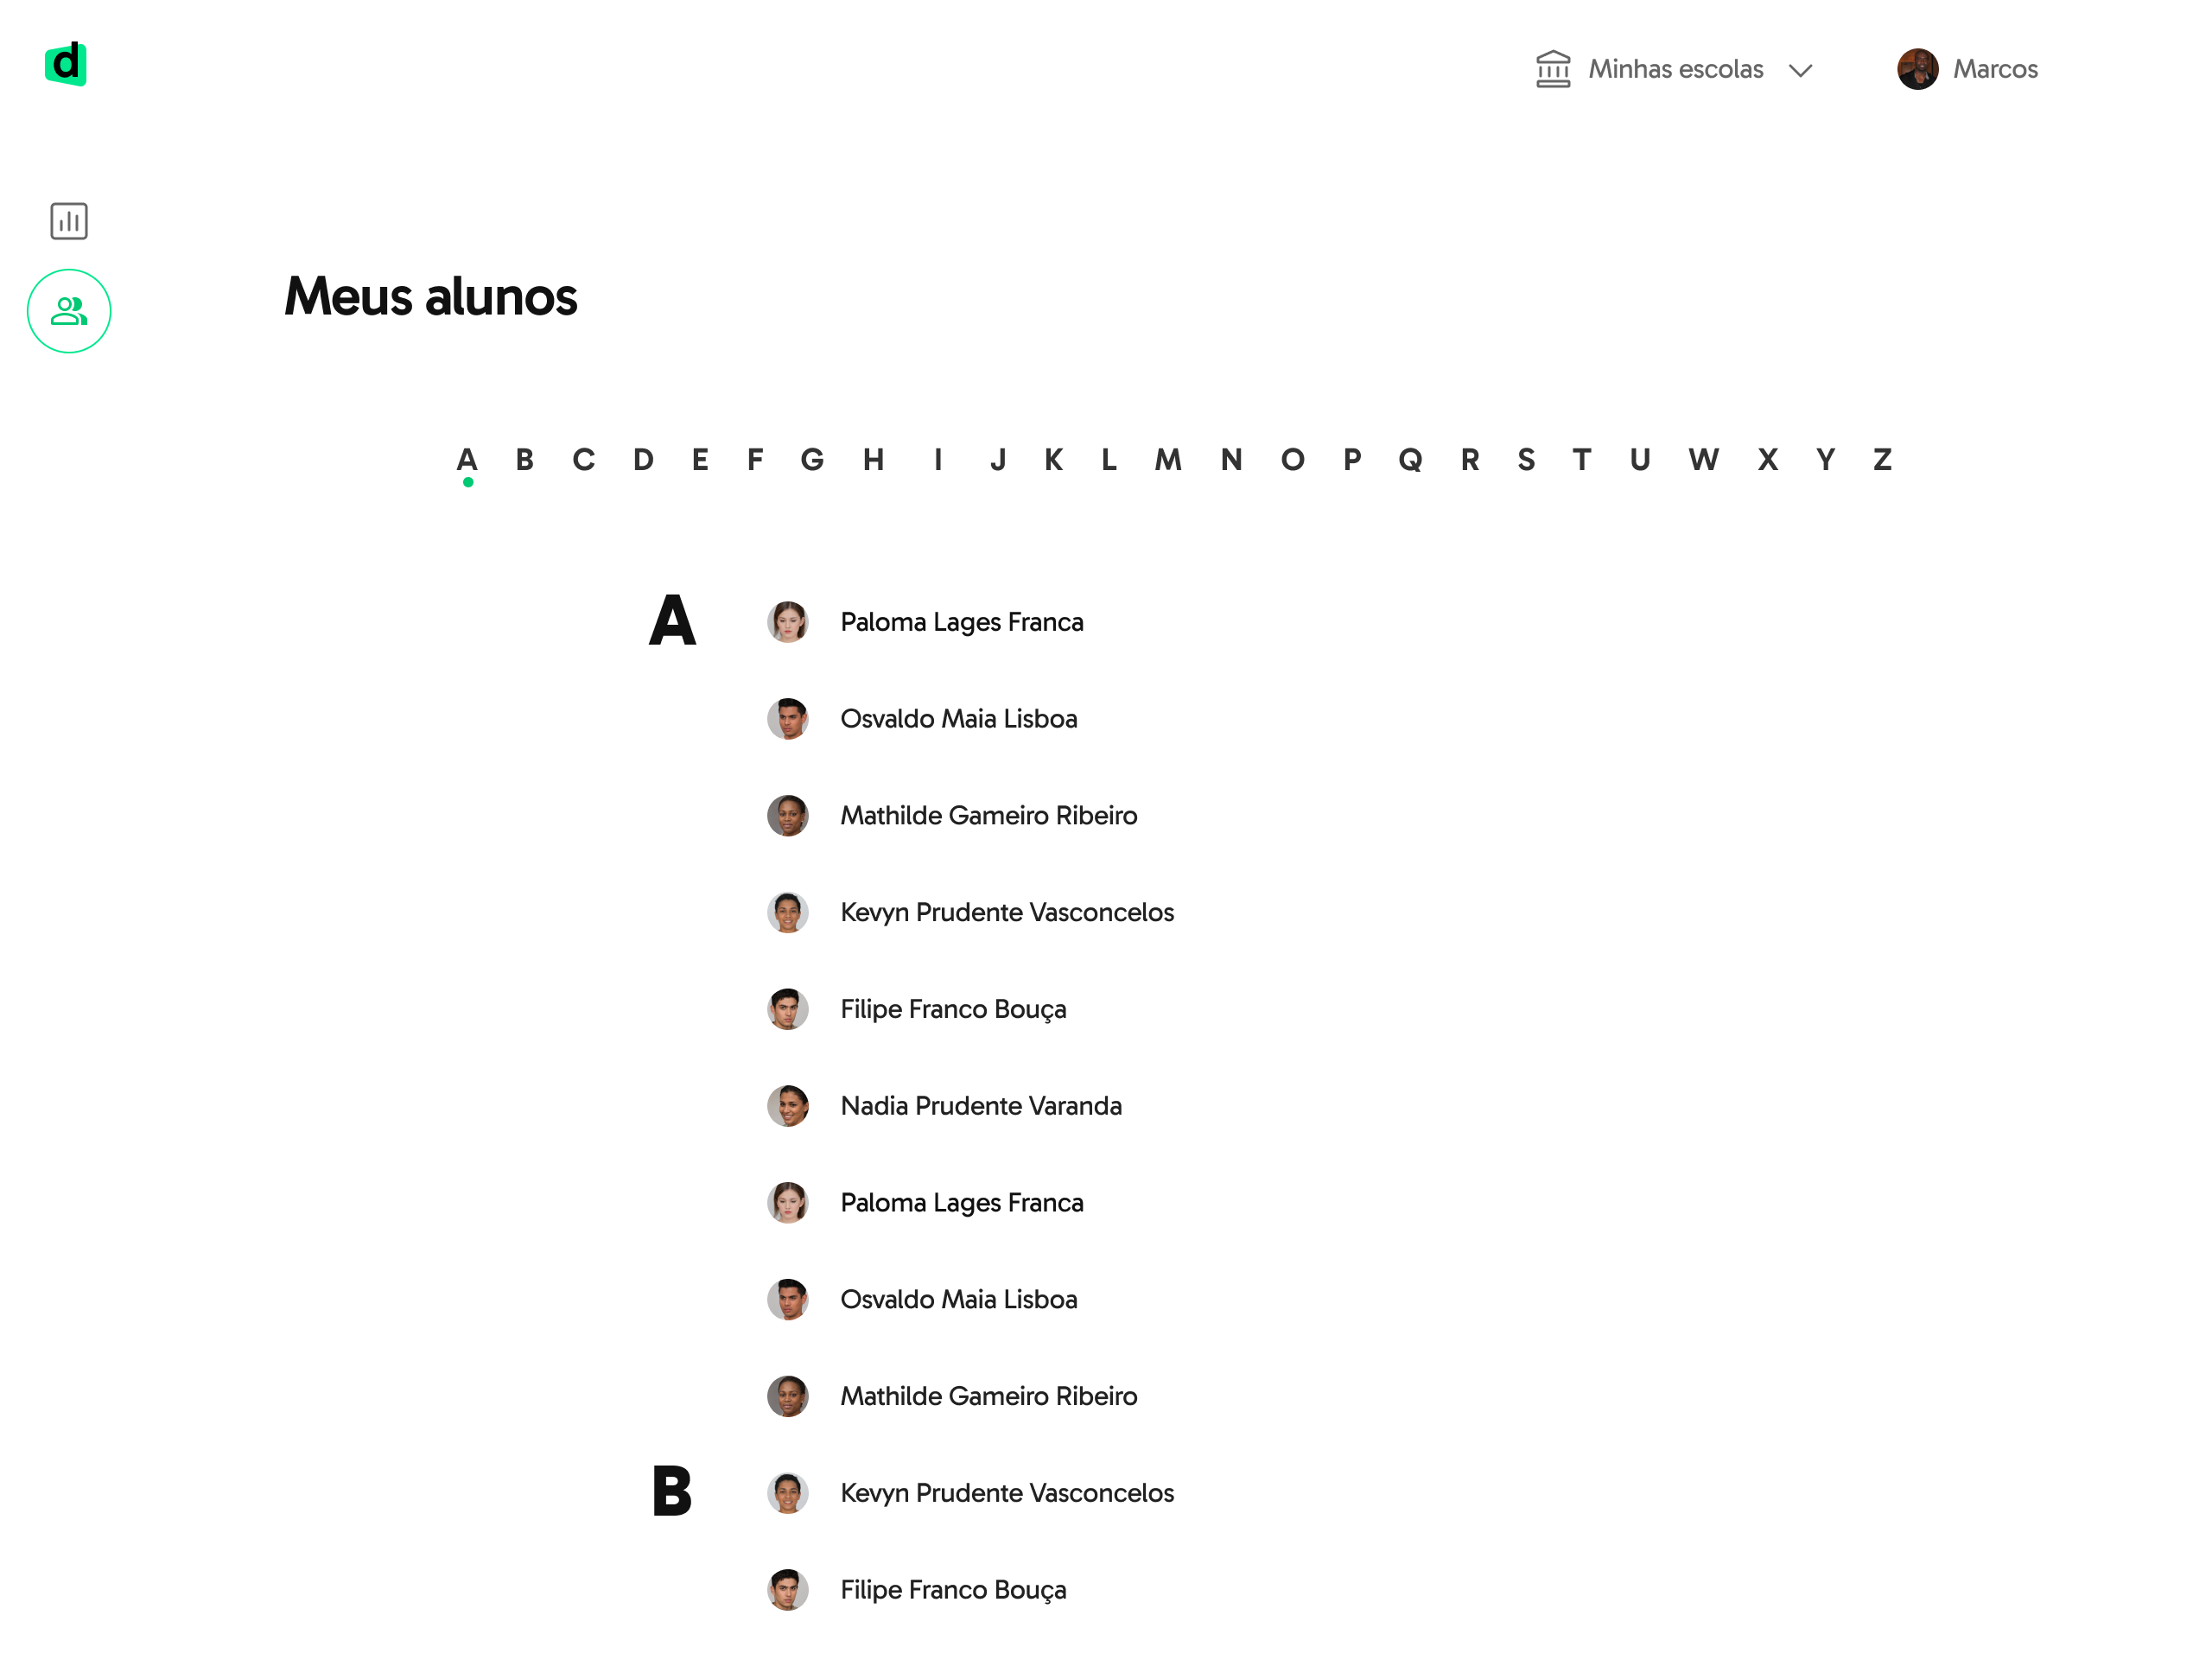
A complete list of students in a school
This solution would allow the manager to access all students on the platform.
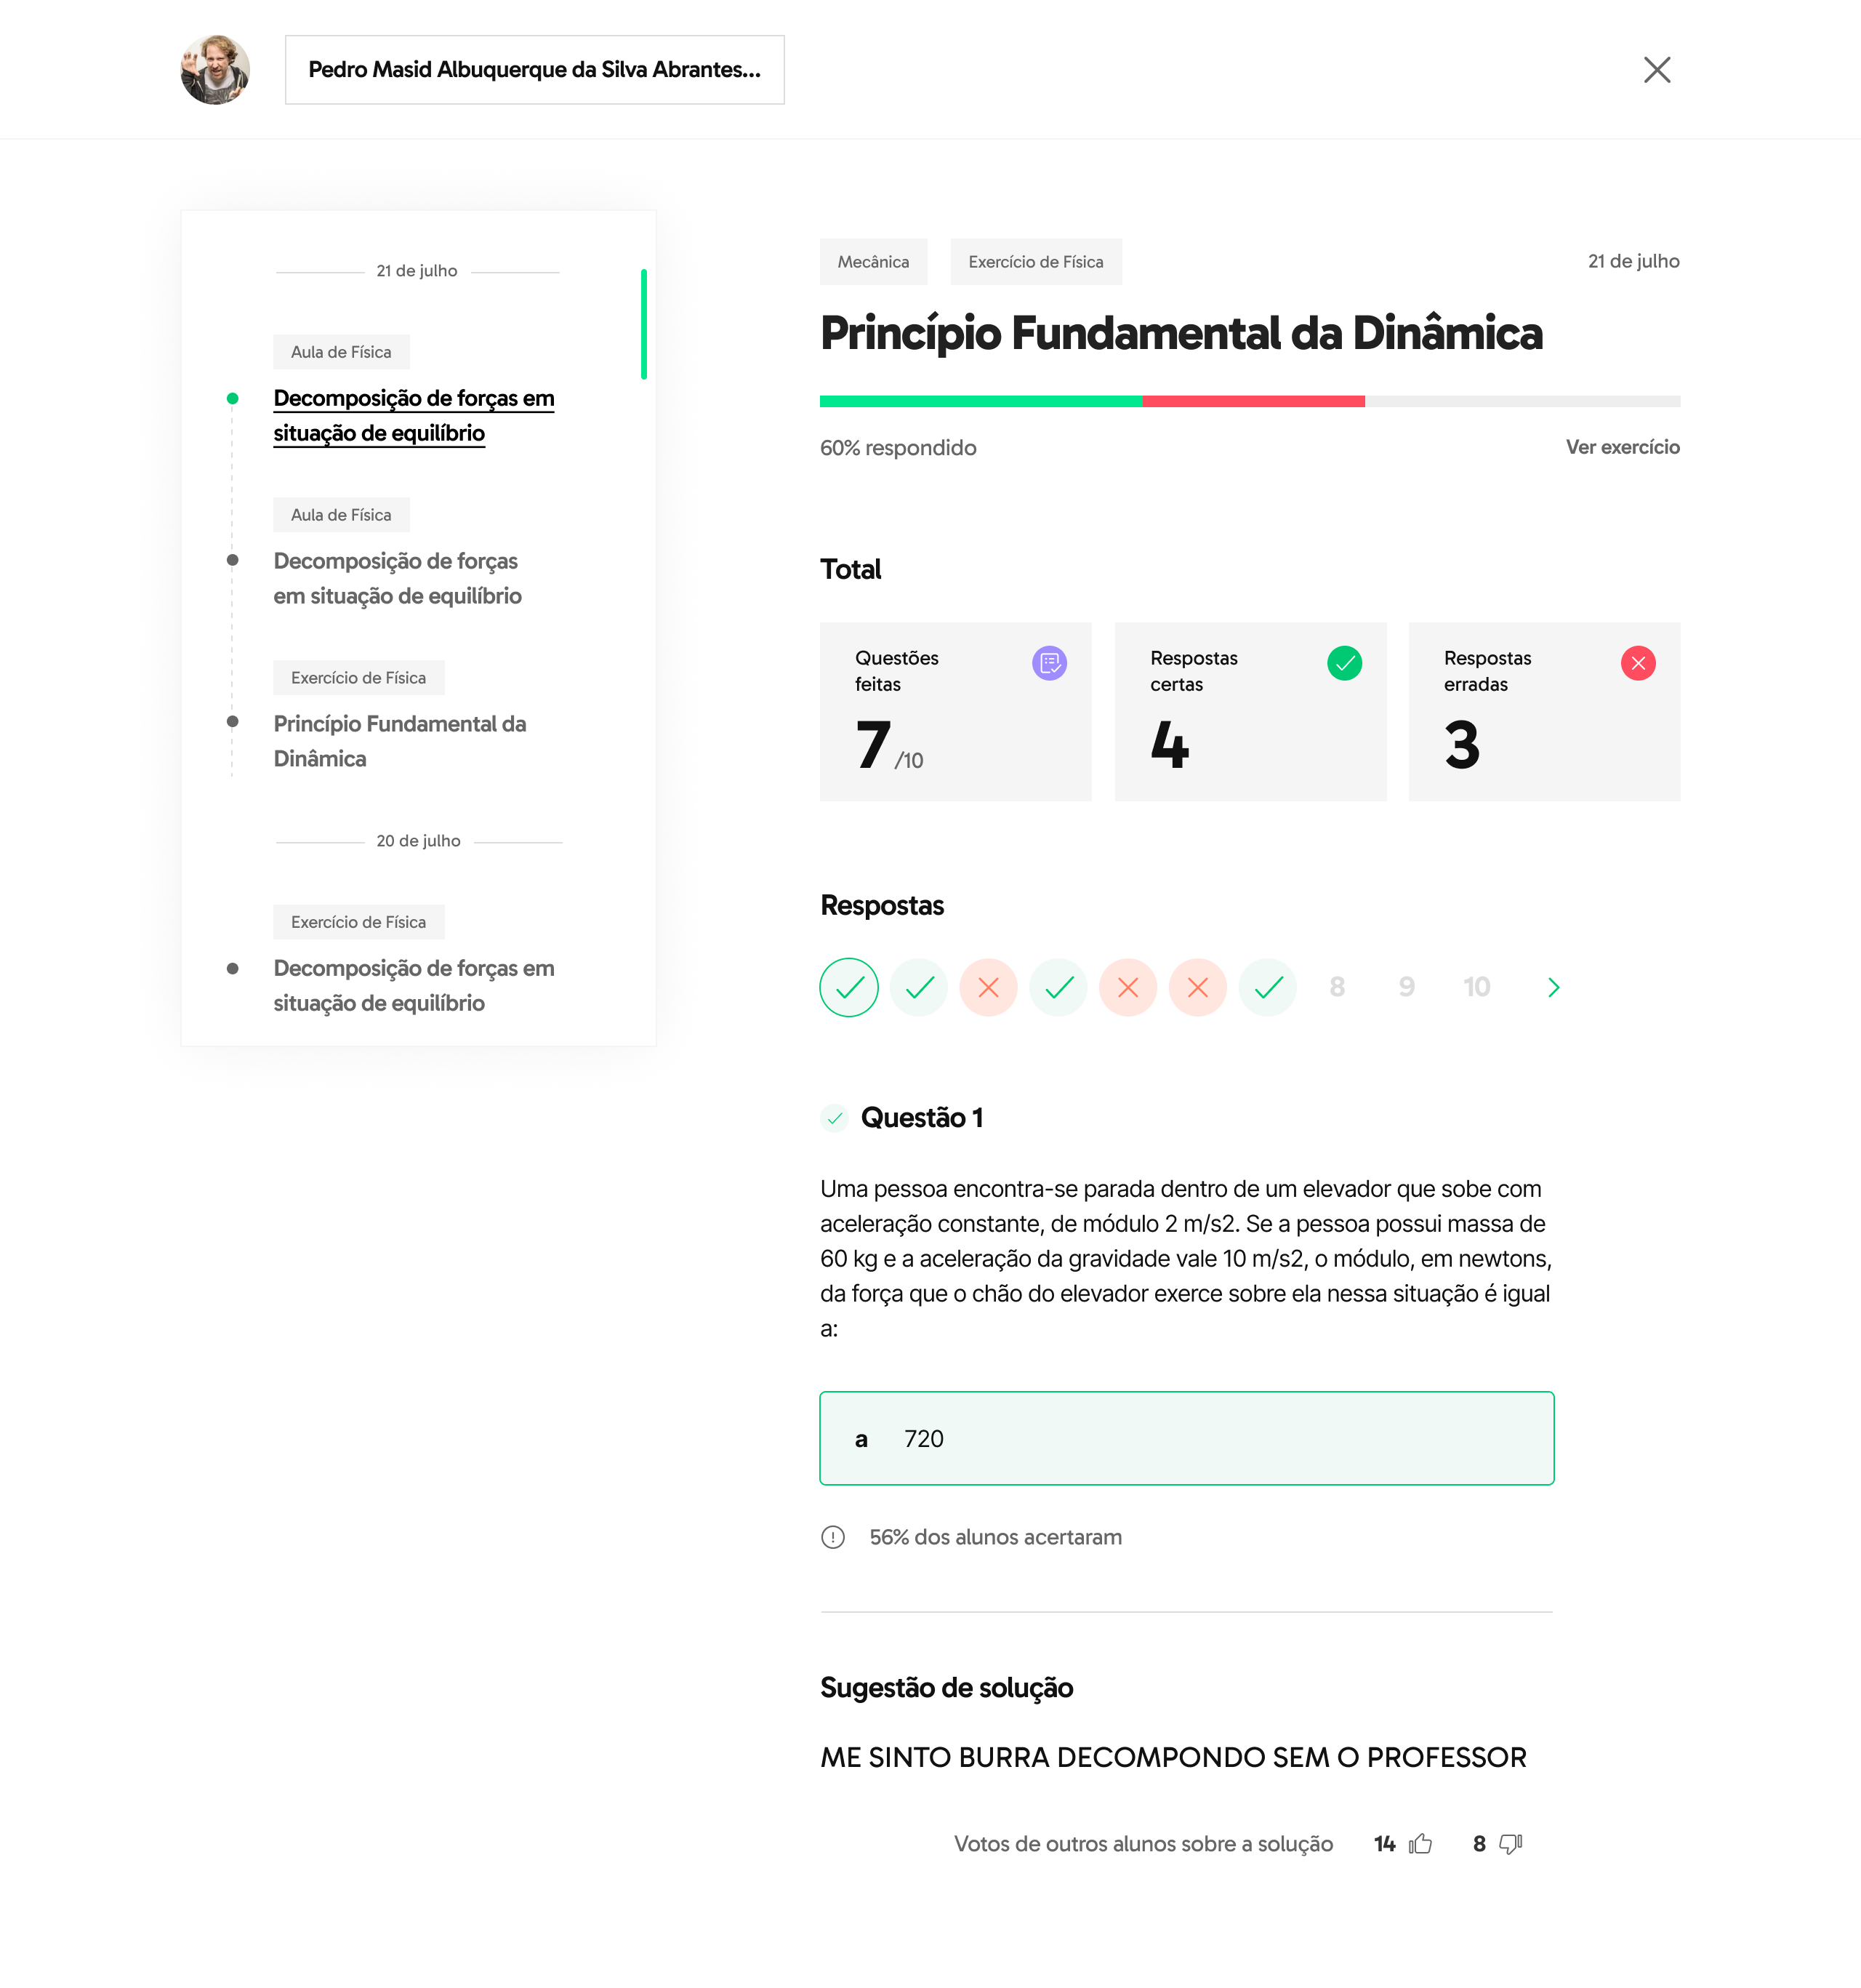
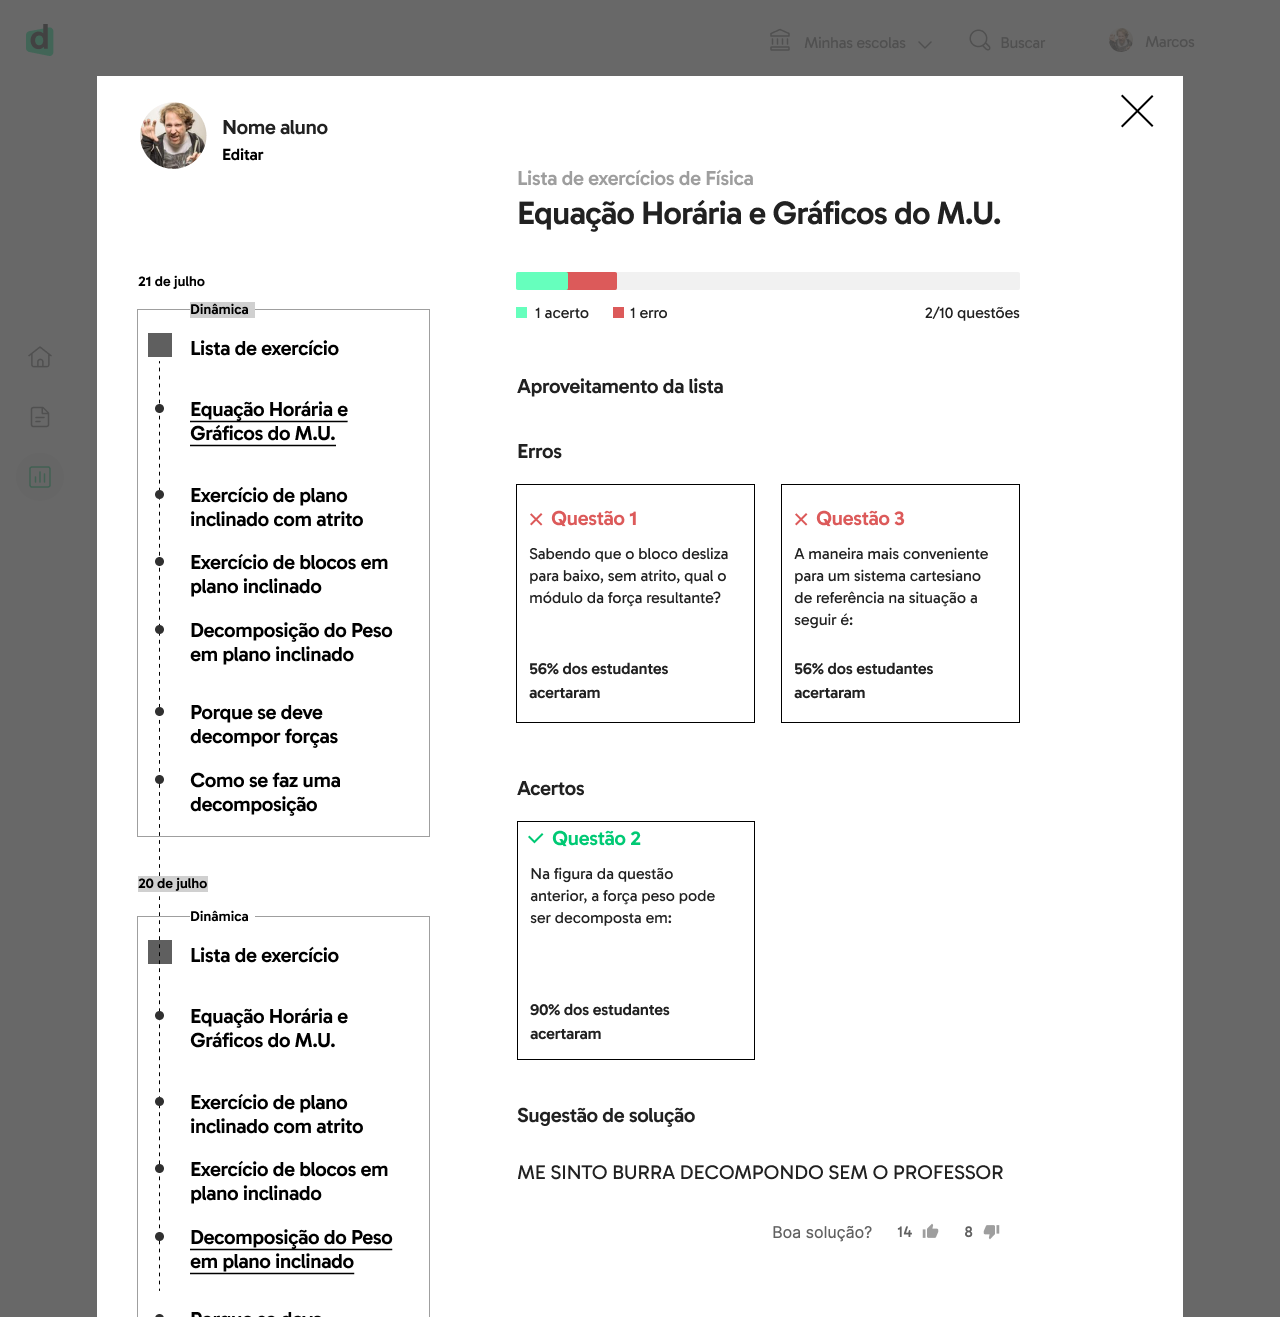
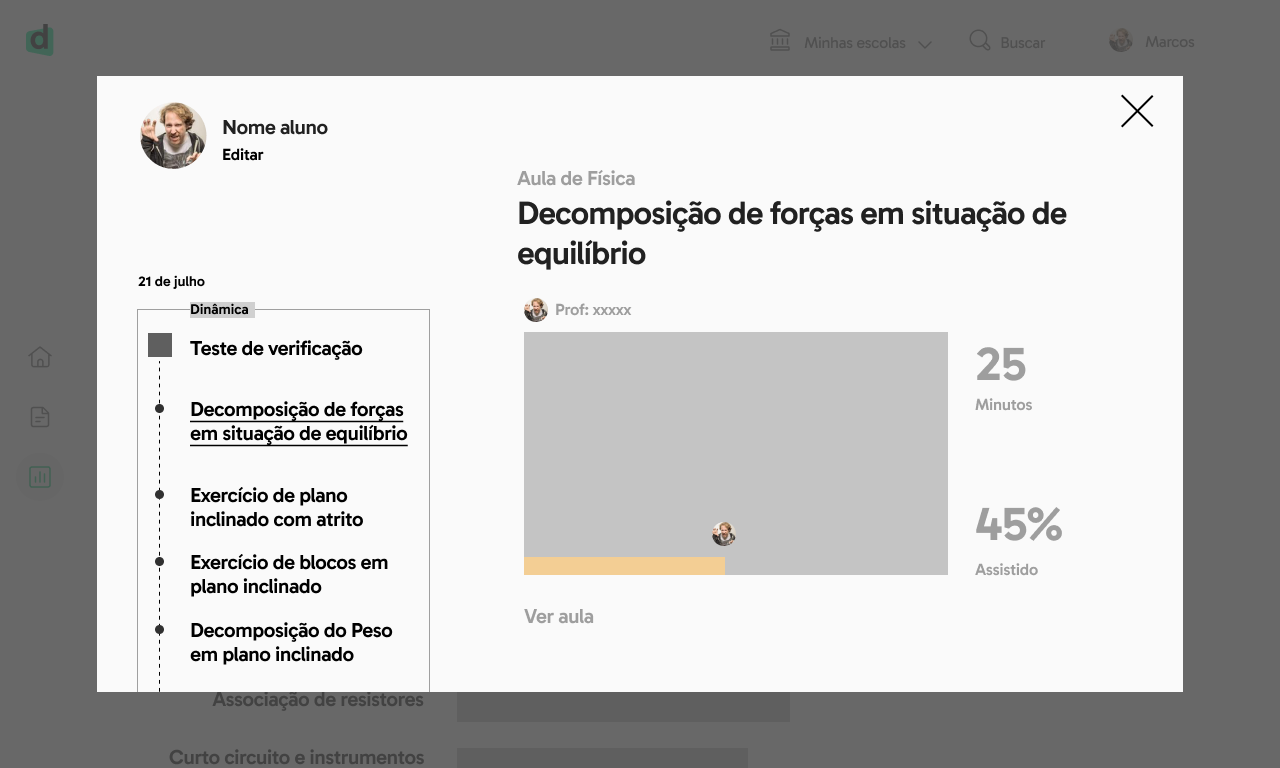
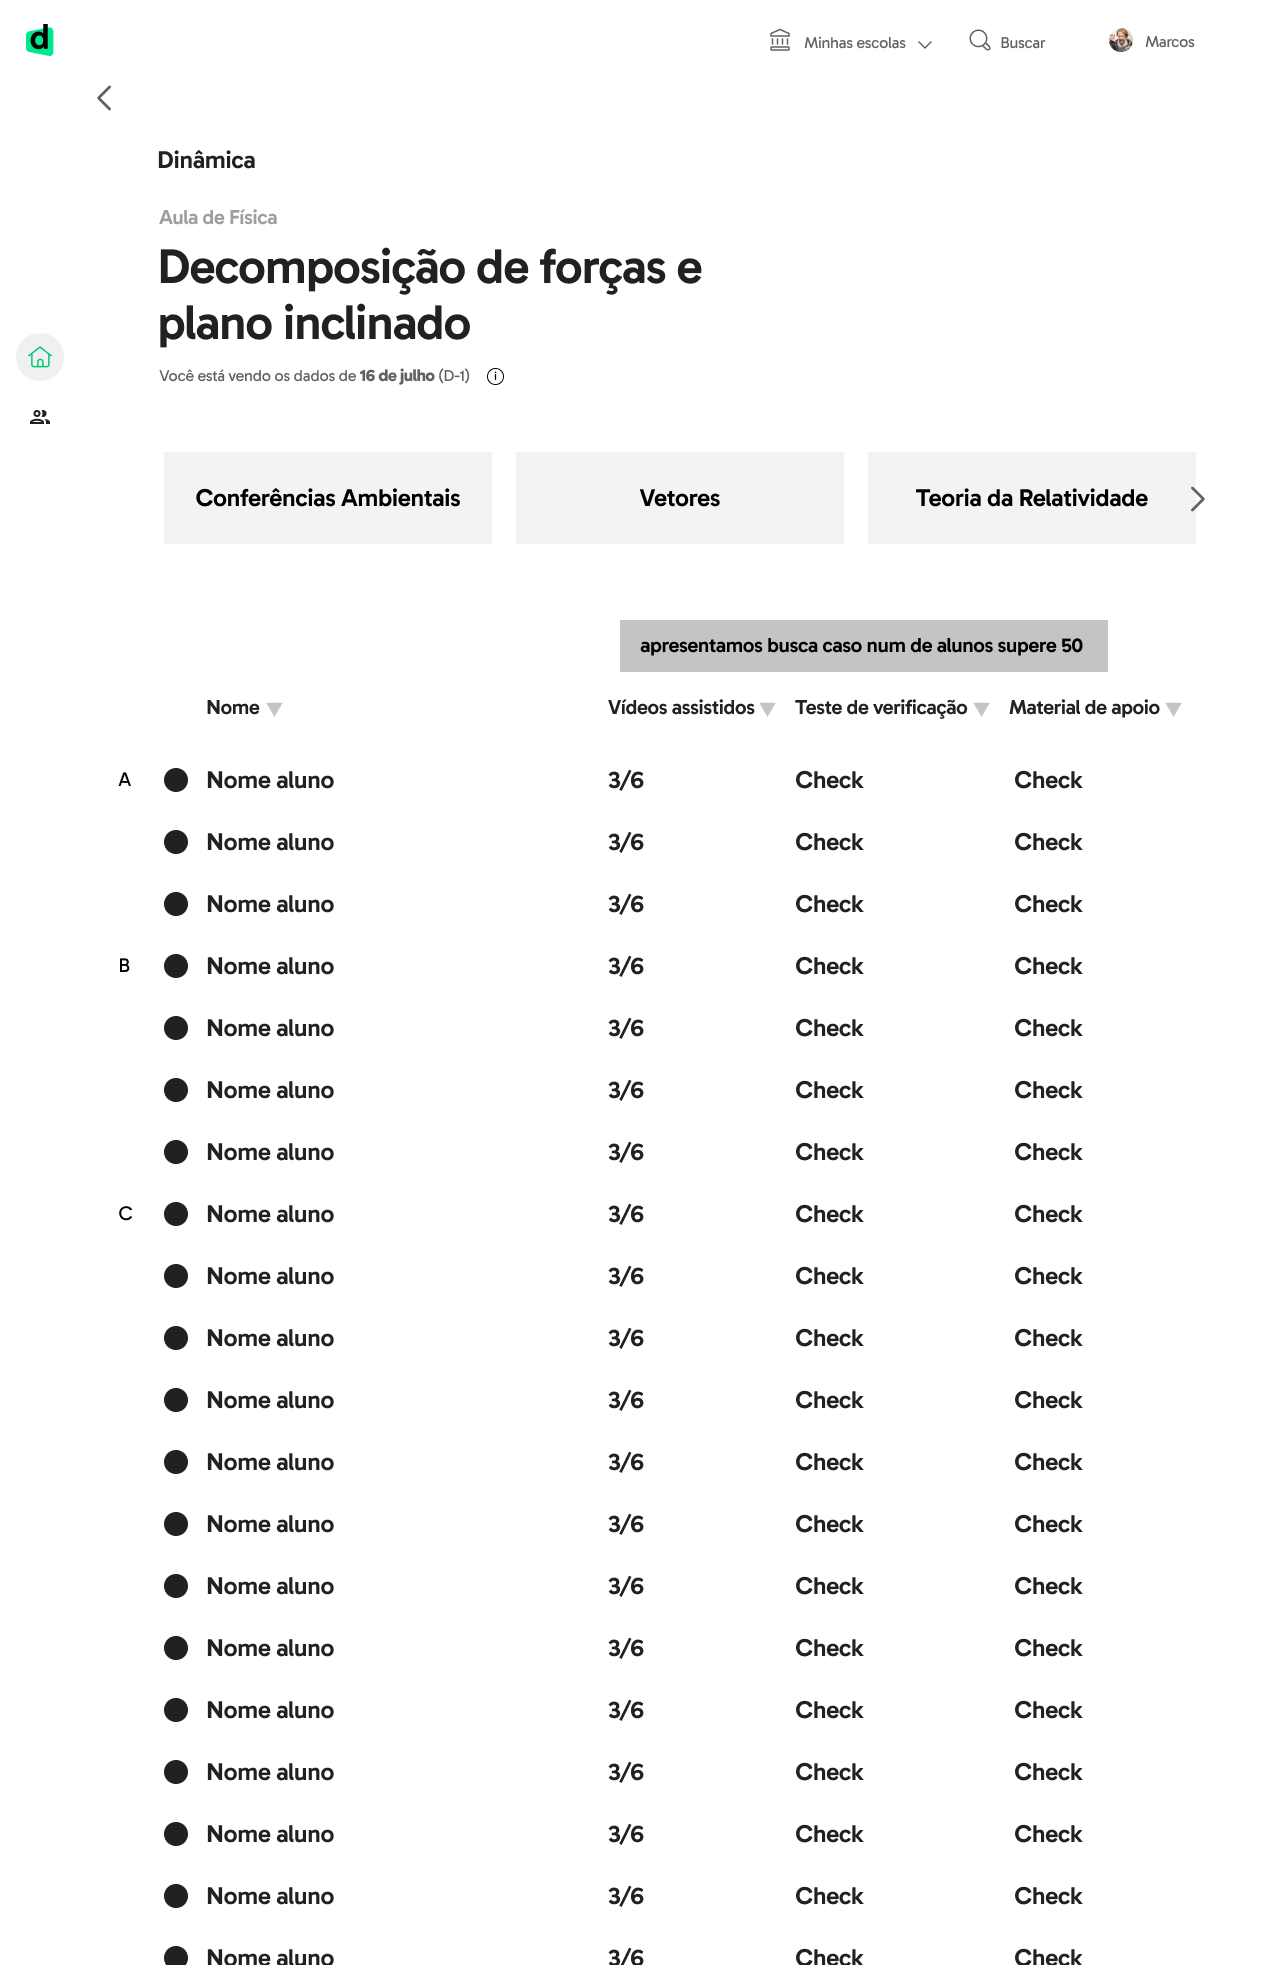
Access to the entire record of student’s activities on the platform
Would provide necessary information to the manager and allow for appropriate decision-making.
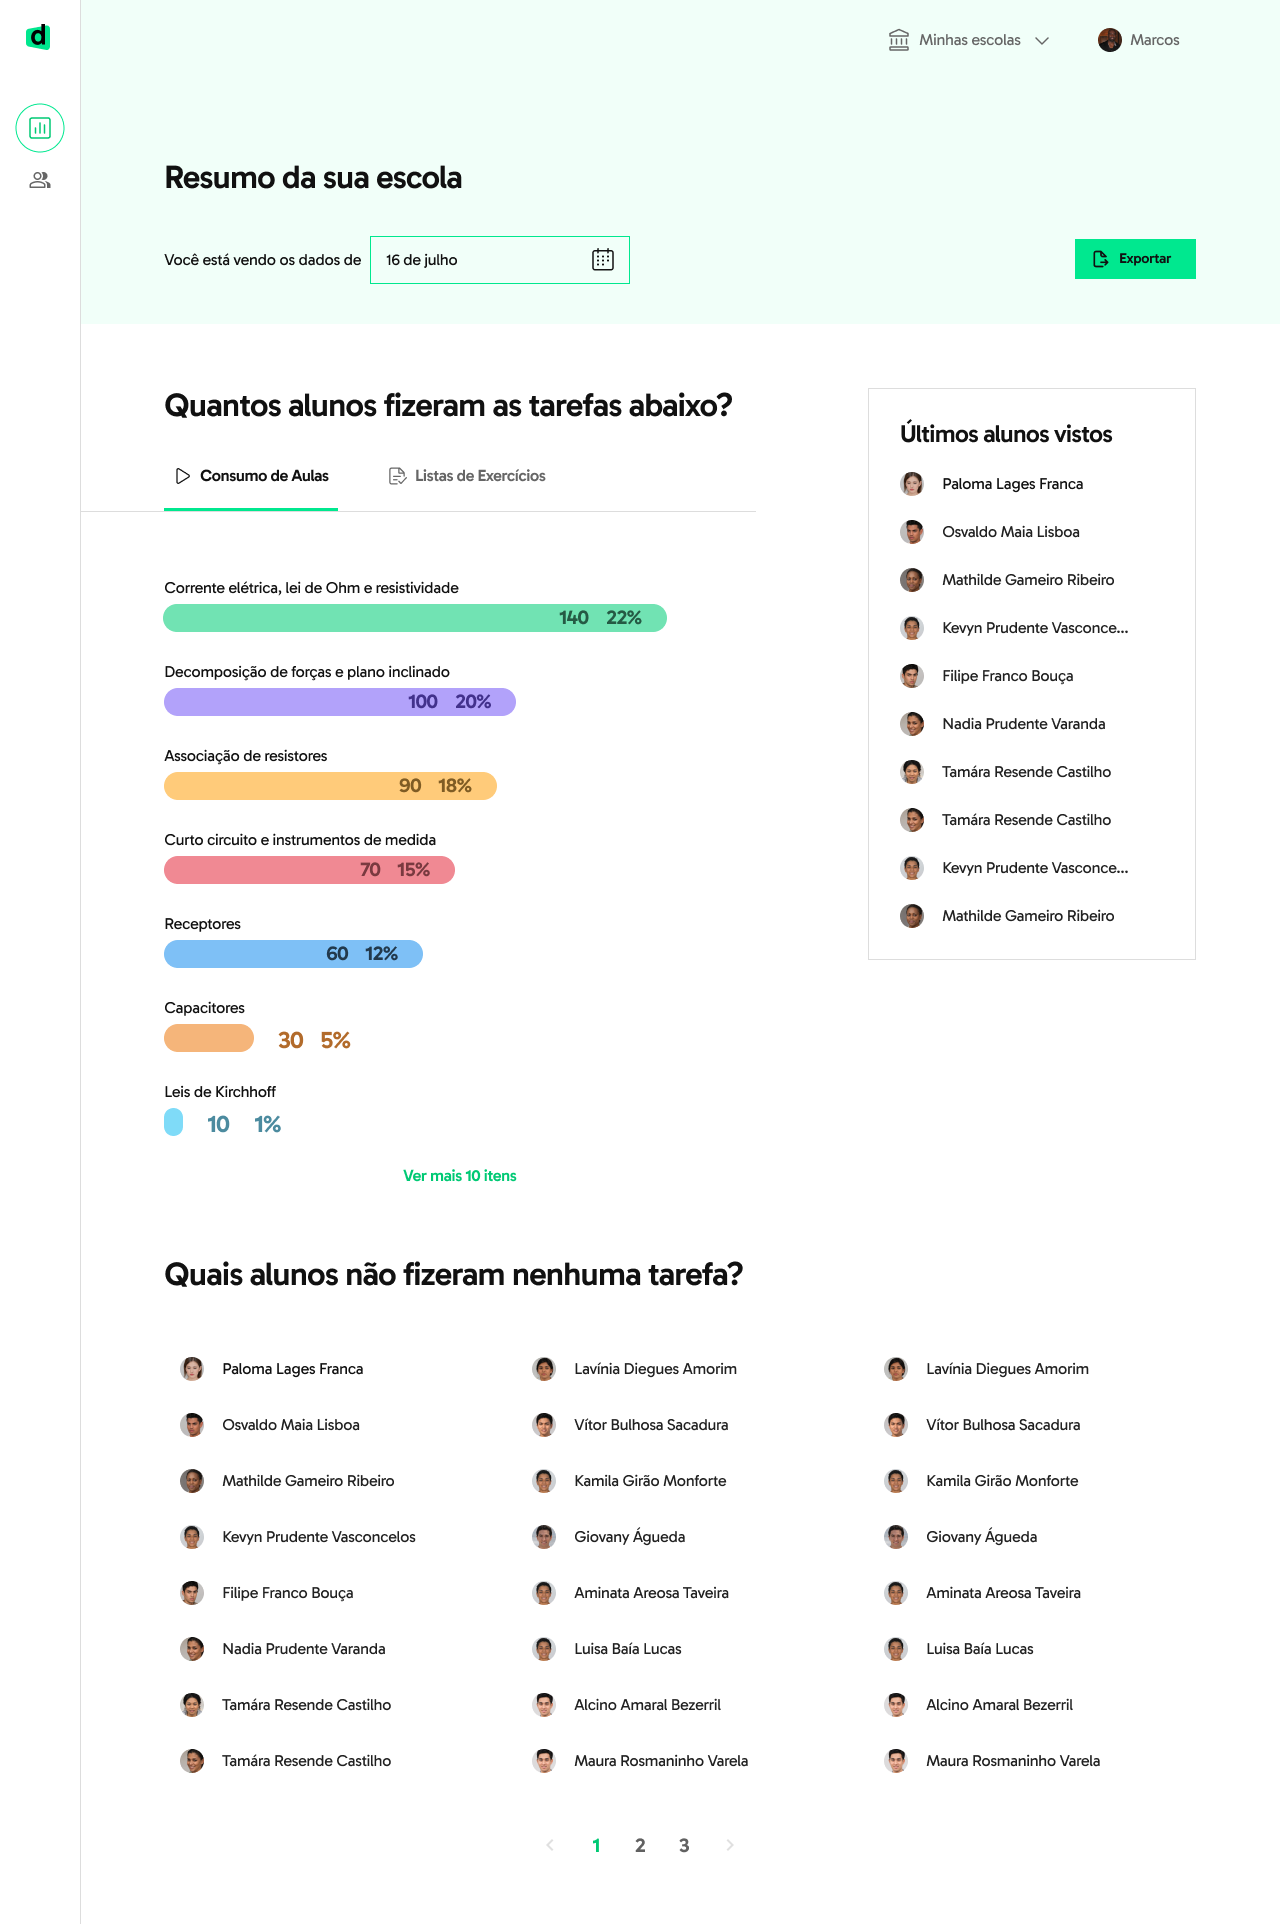
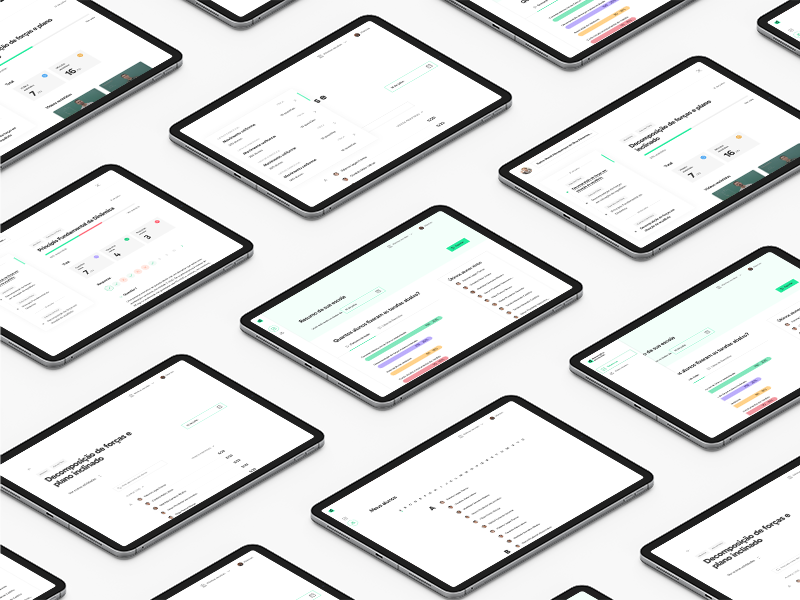
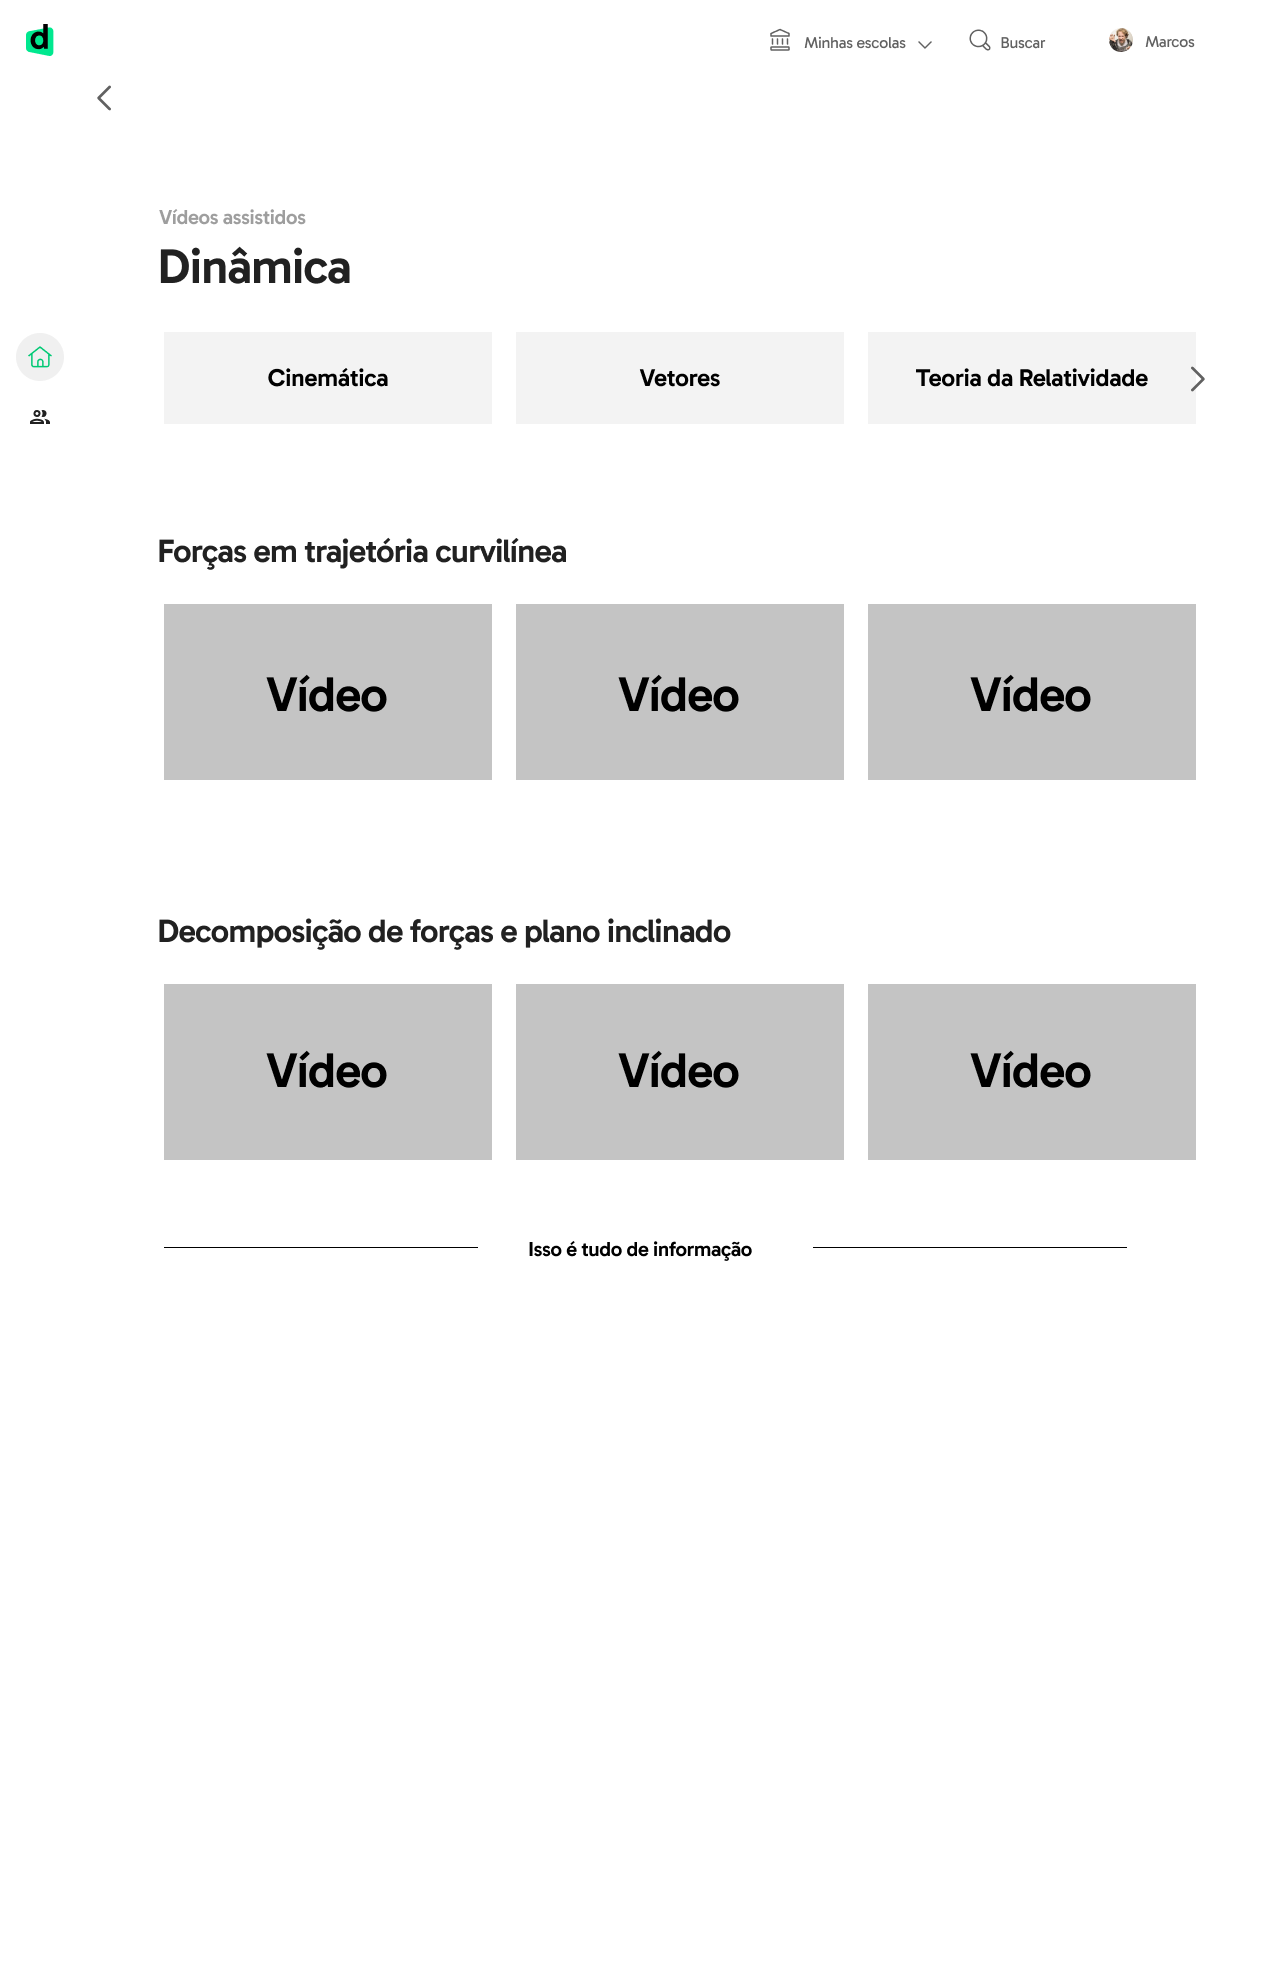
Visual solutions for the first release
Home
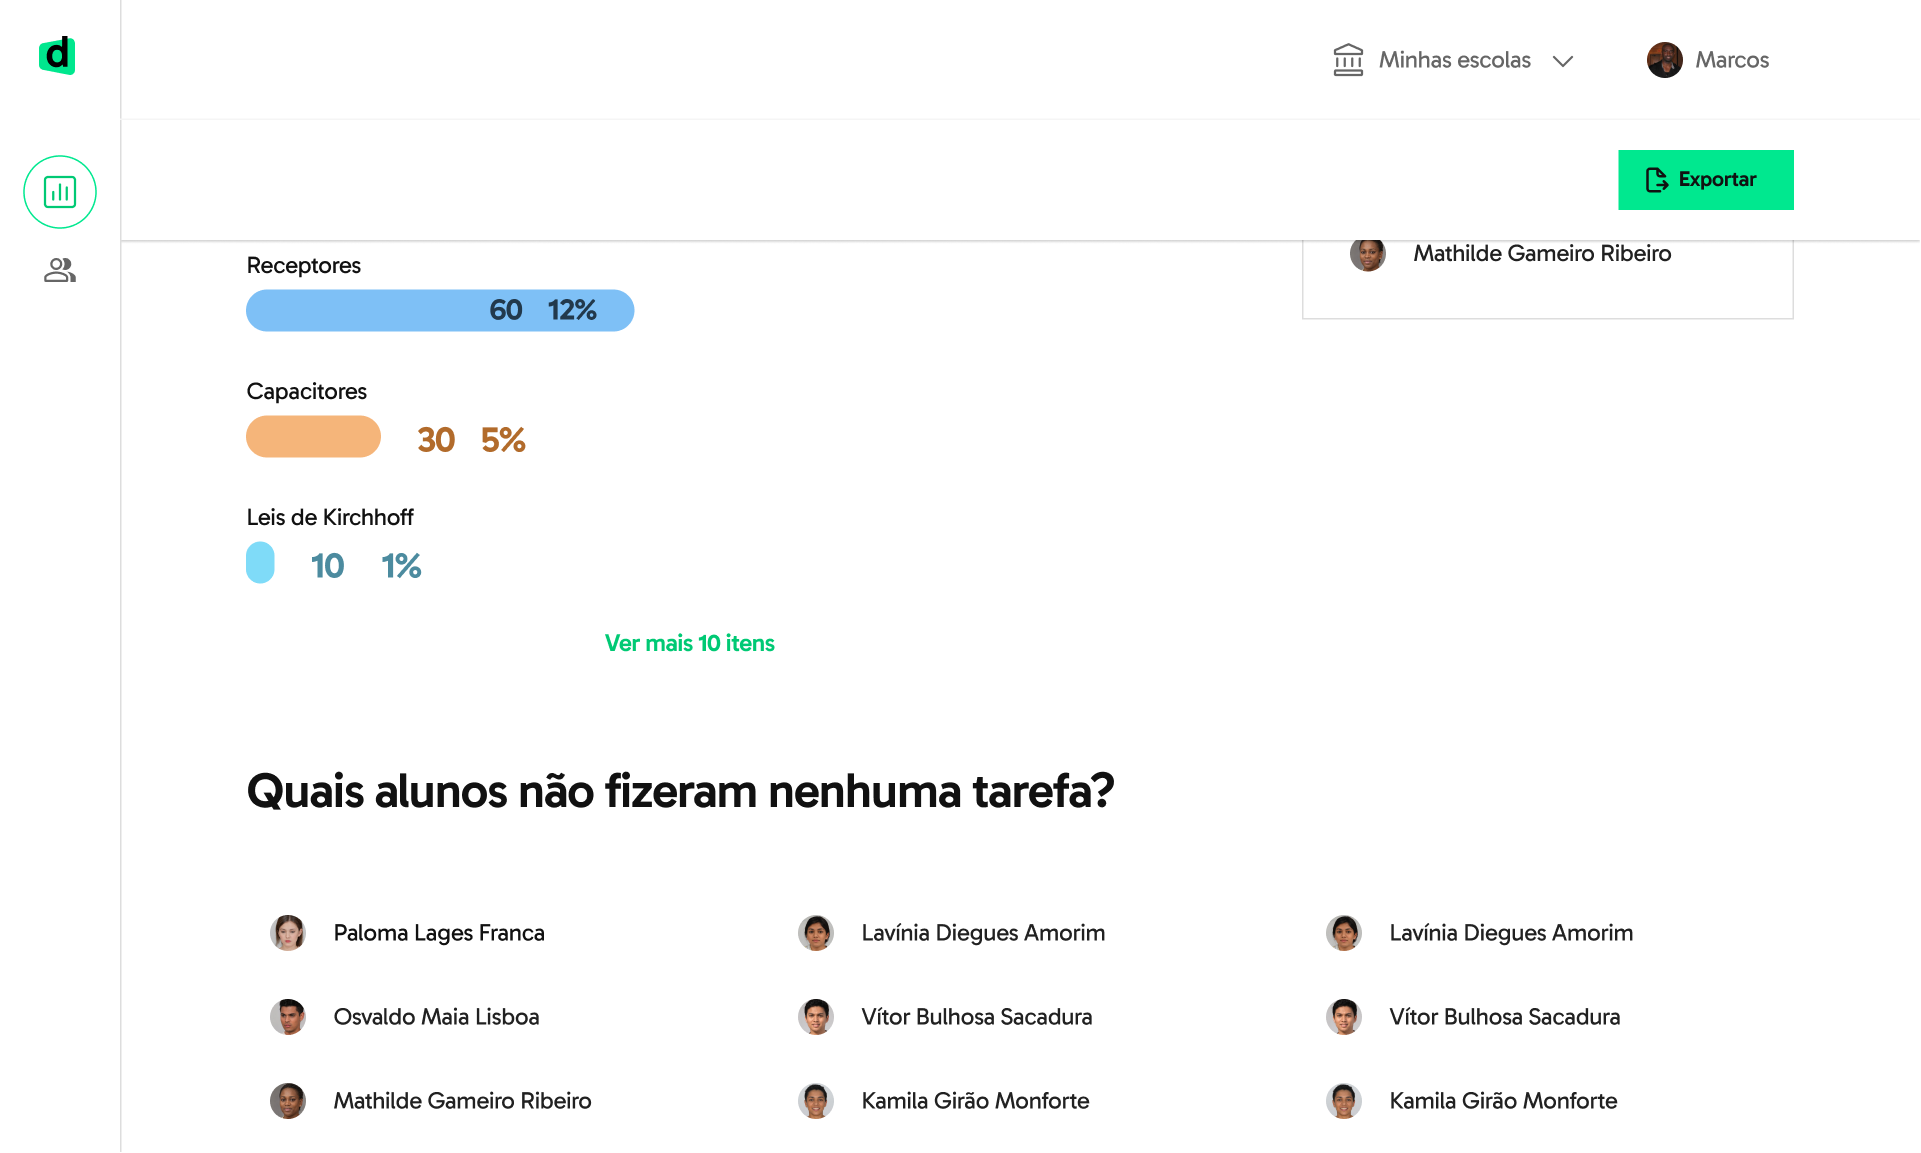
Home scrolling
Menu opened
Class
Classes dropdown

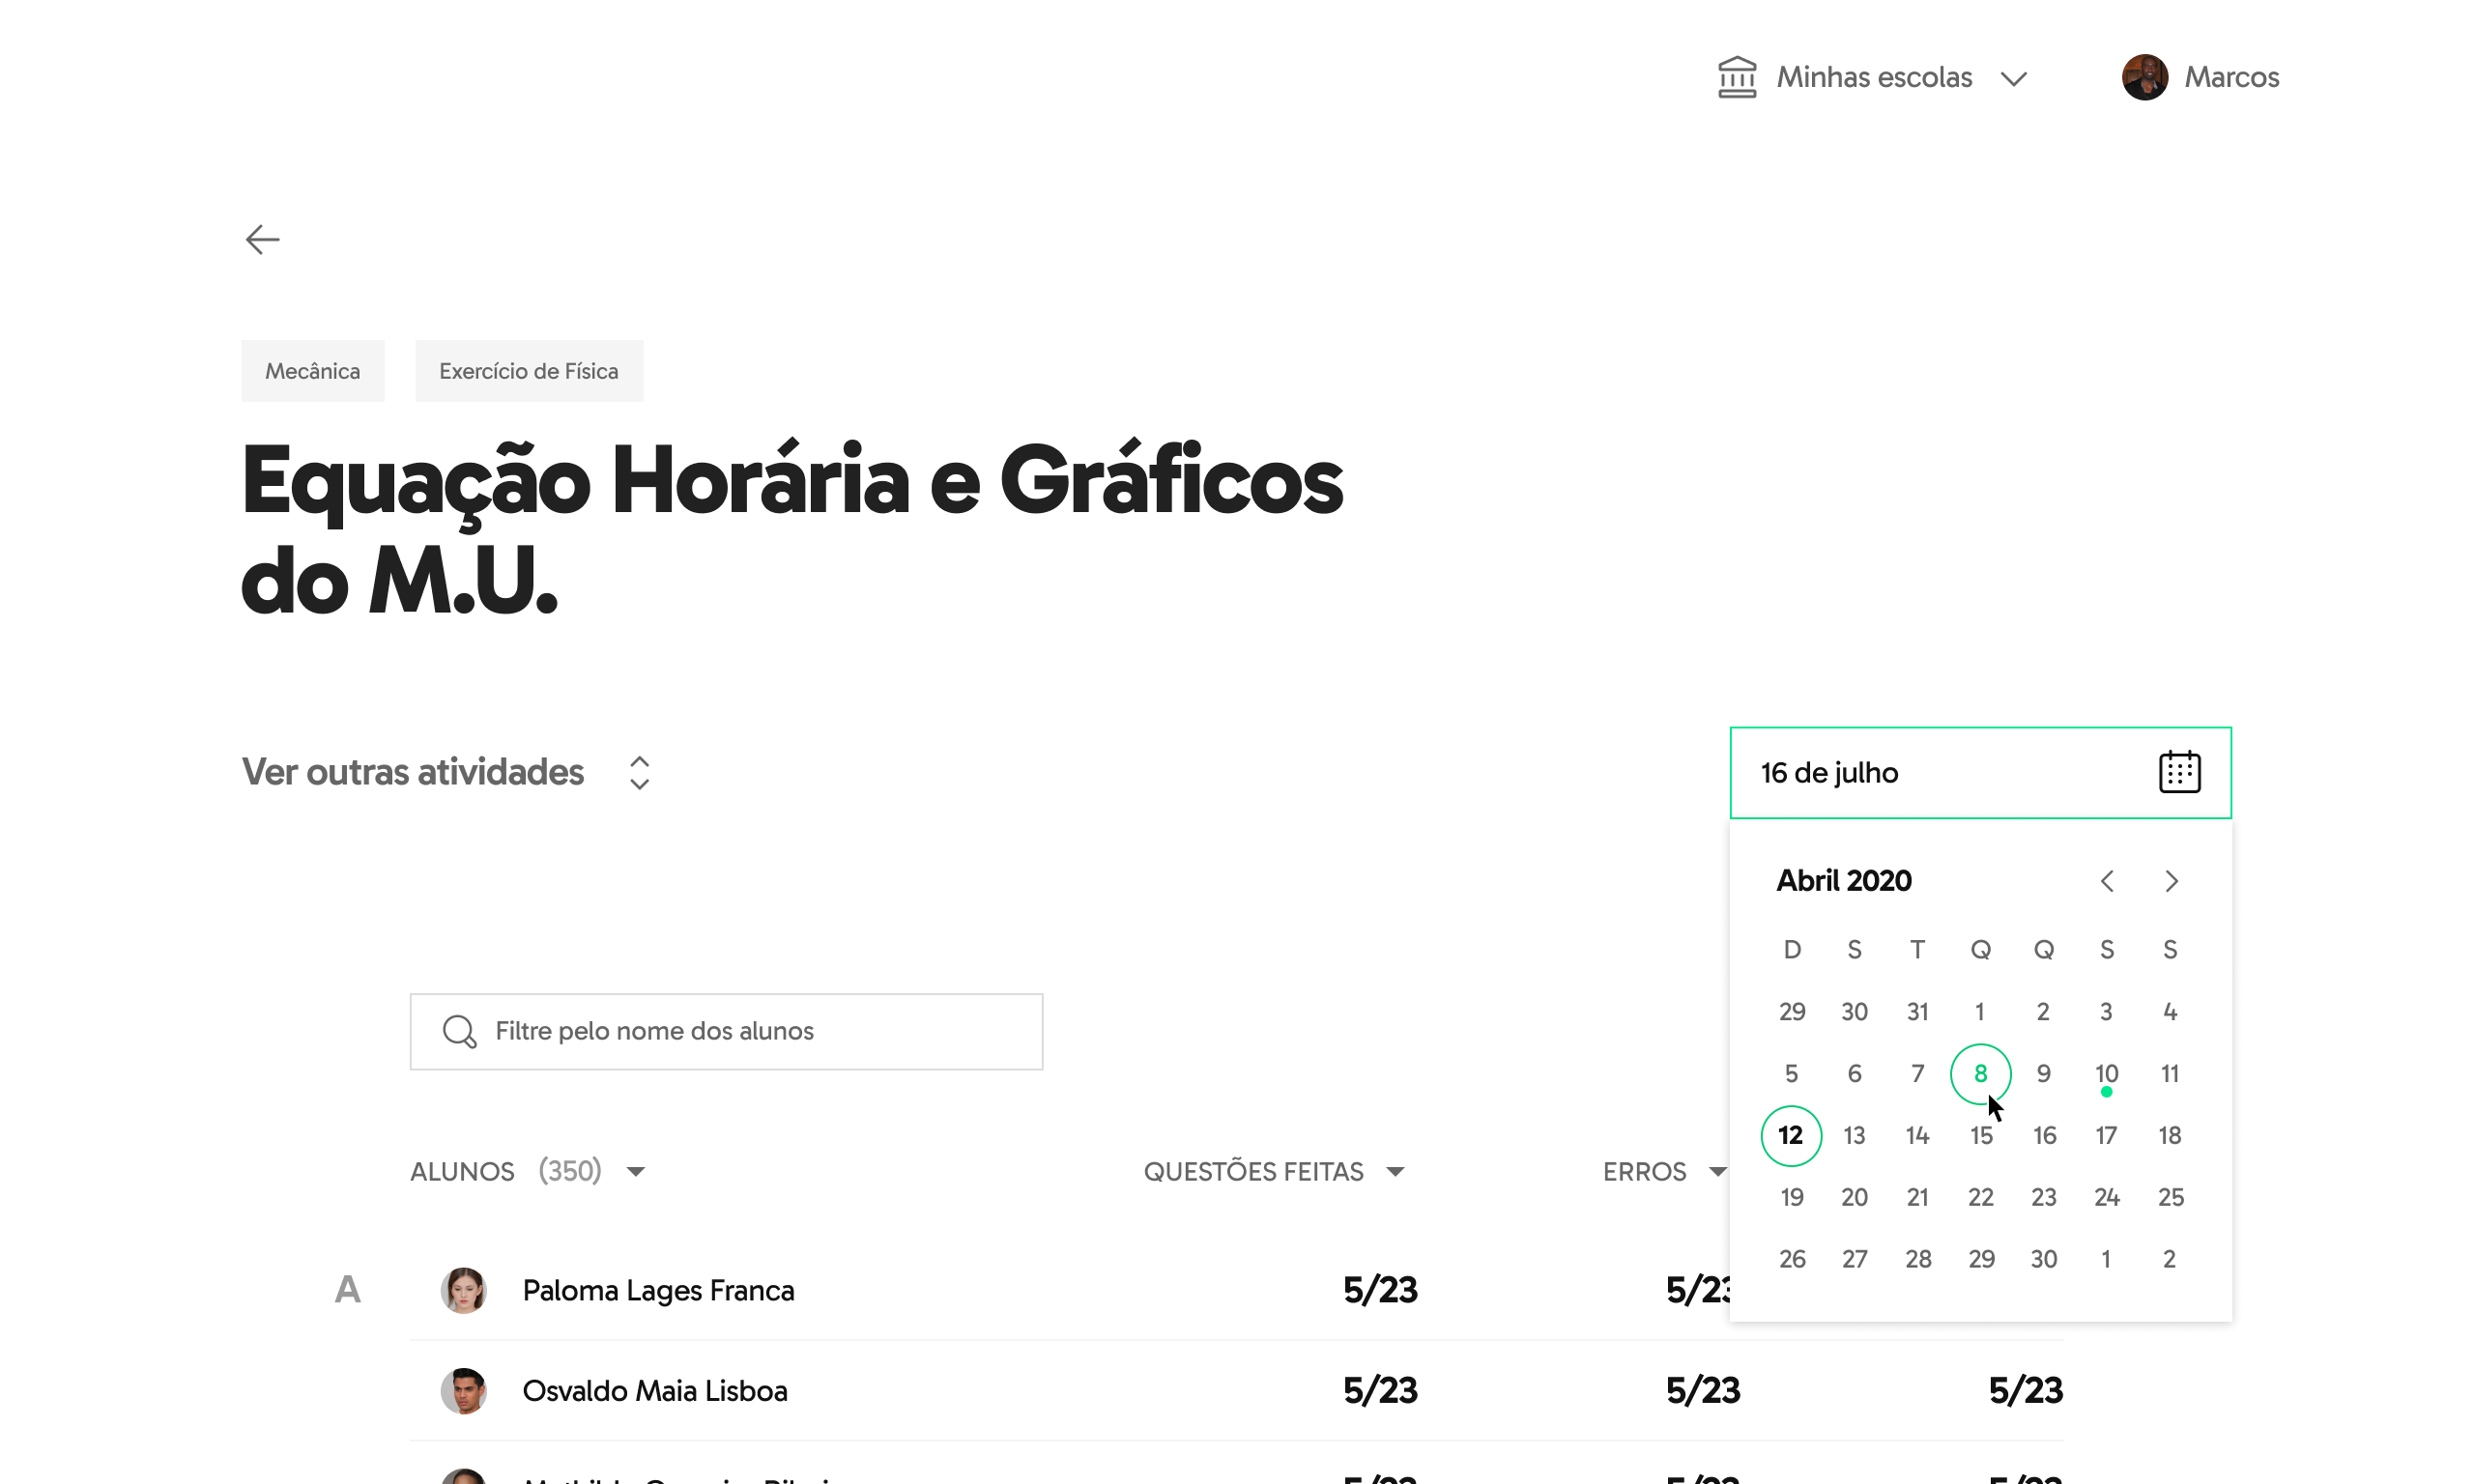
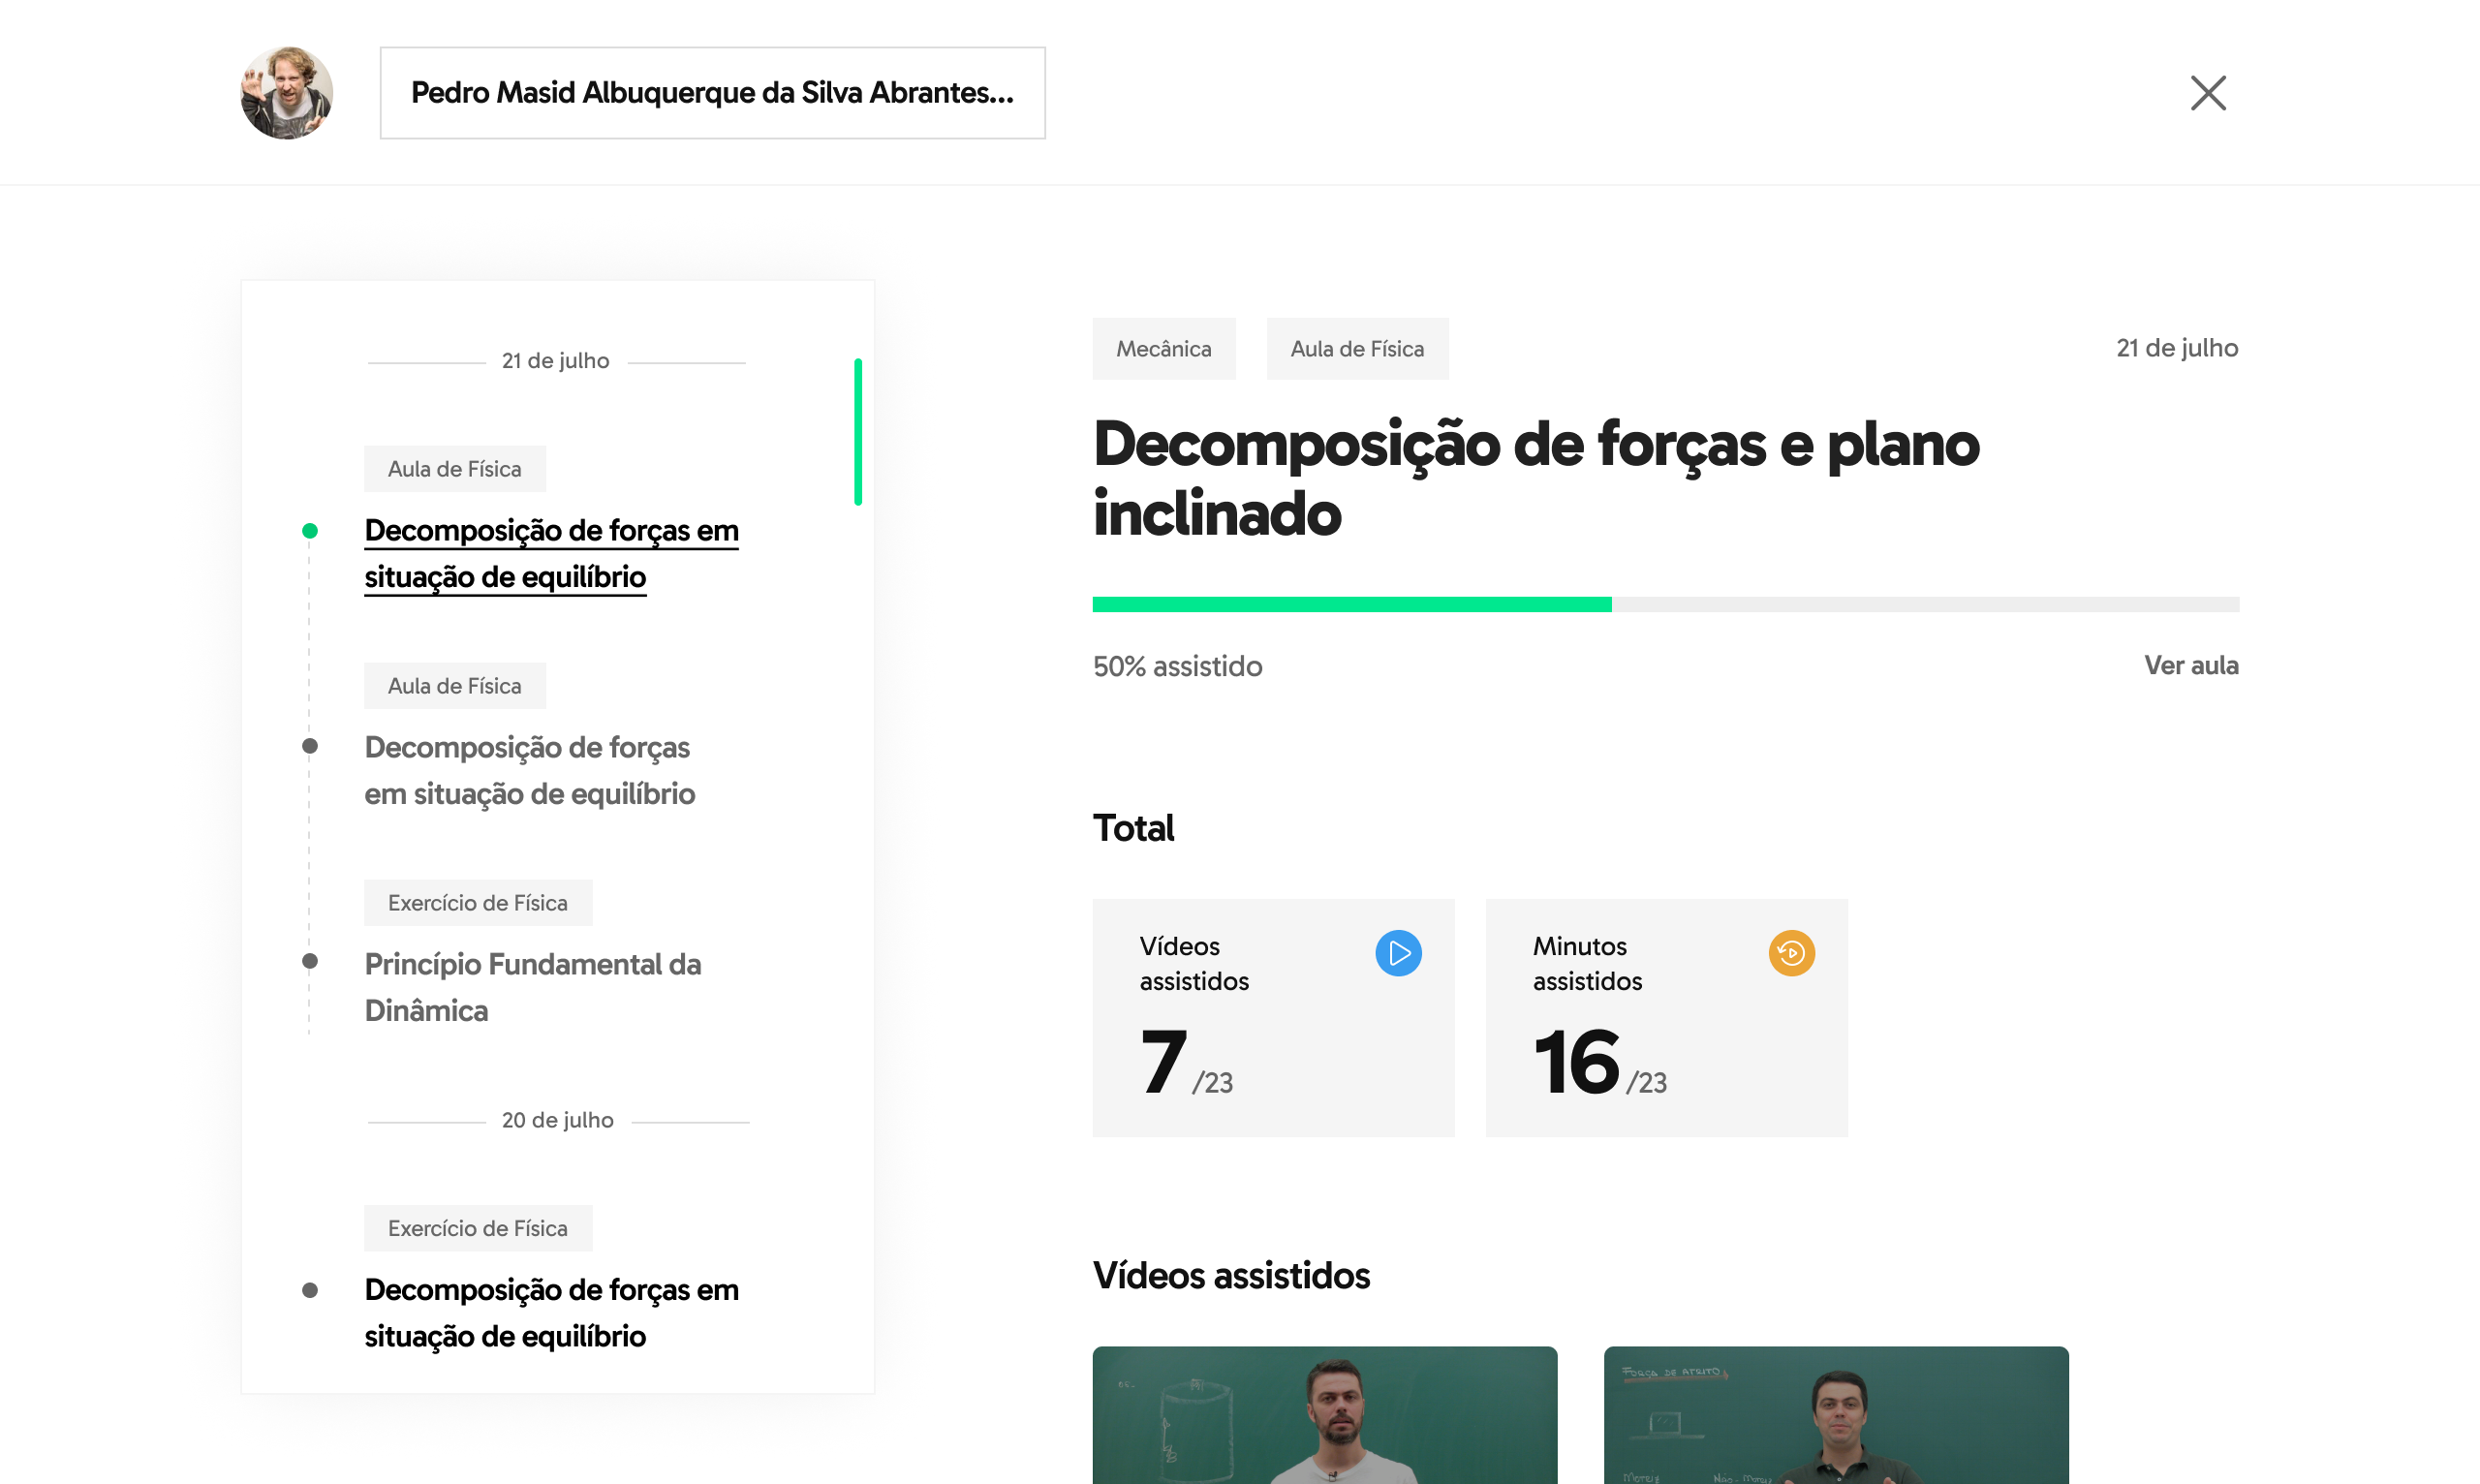
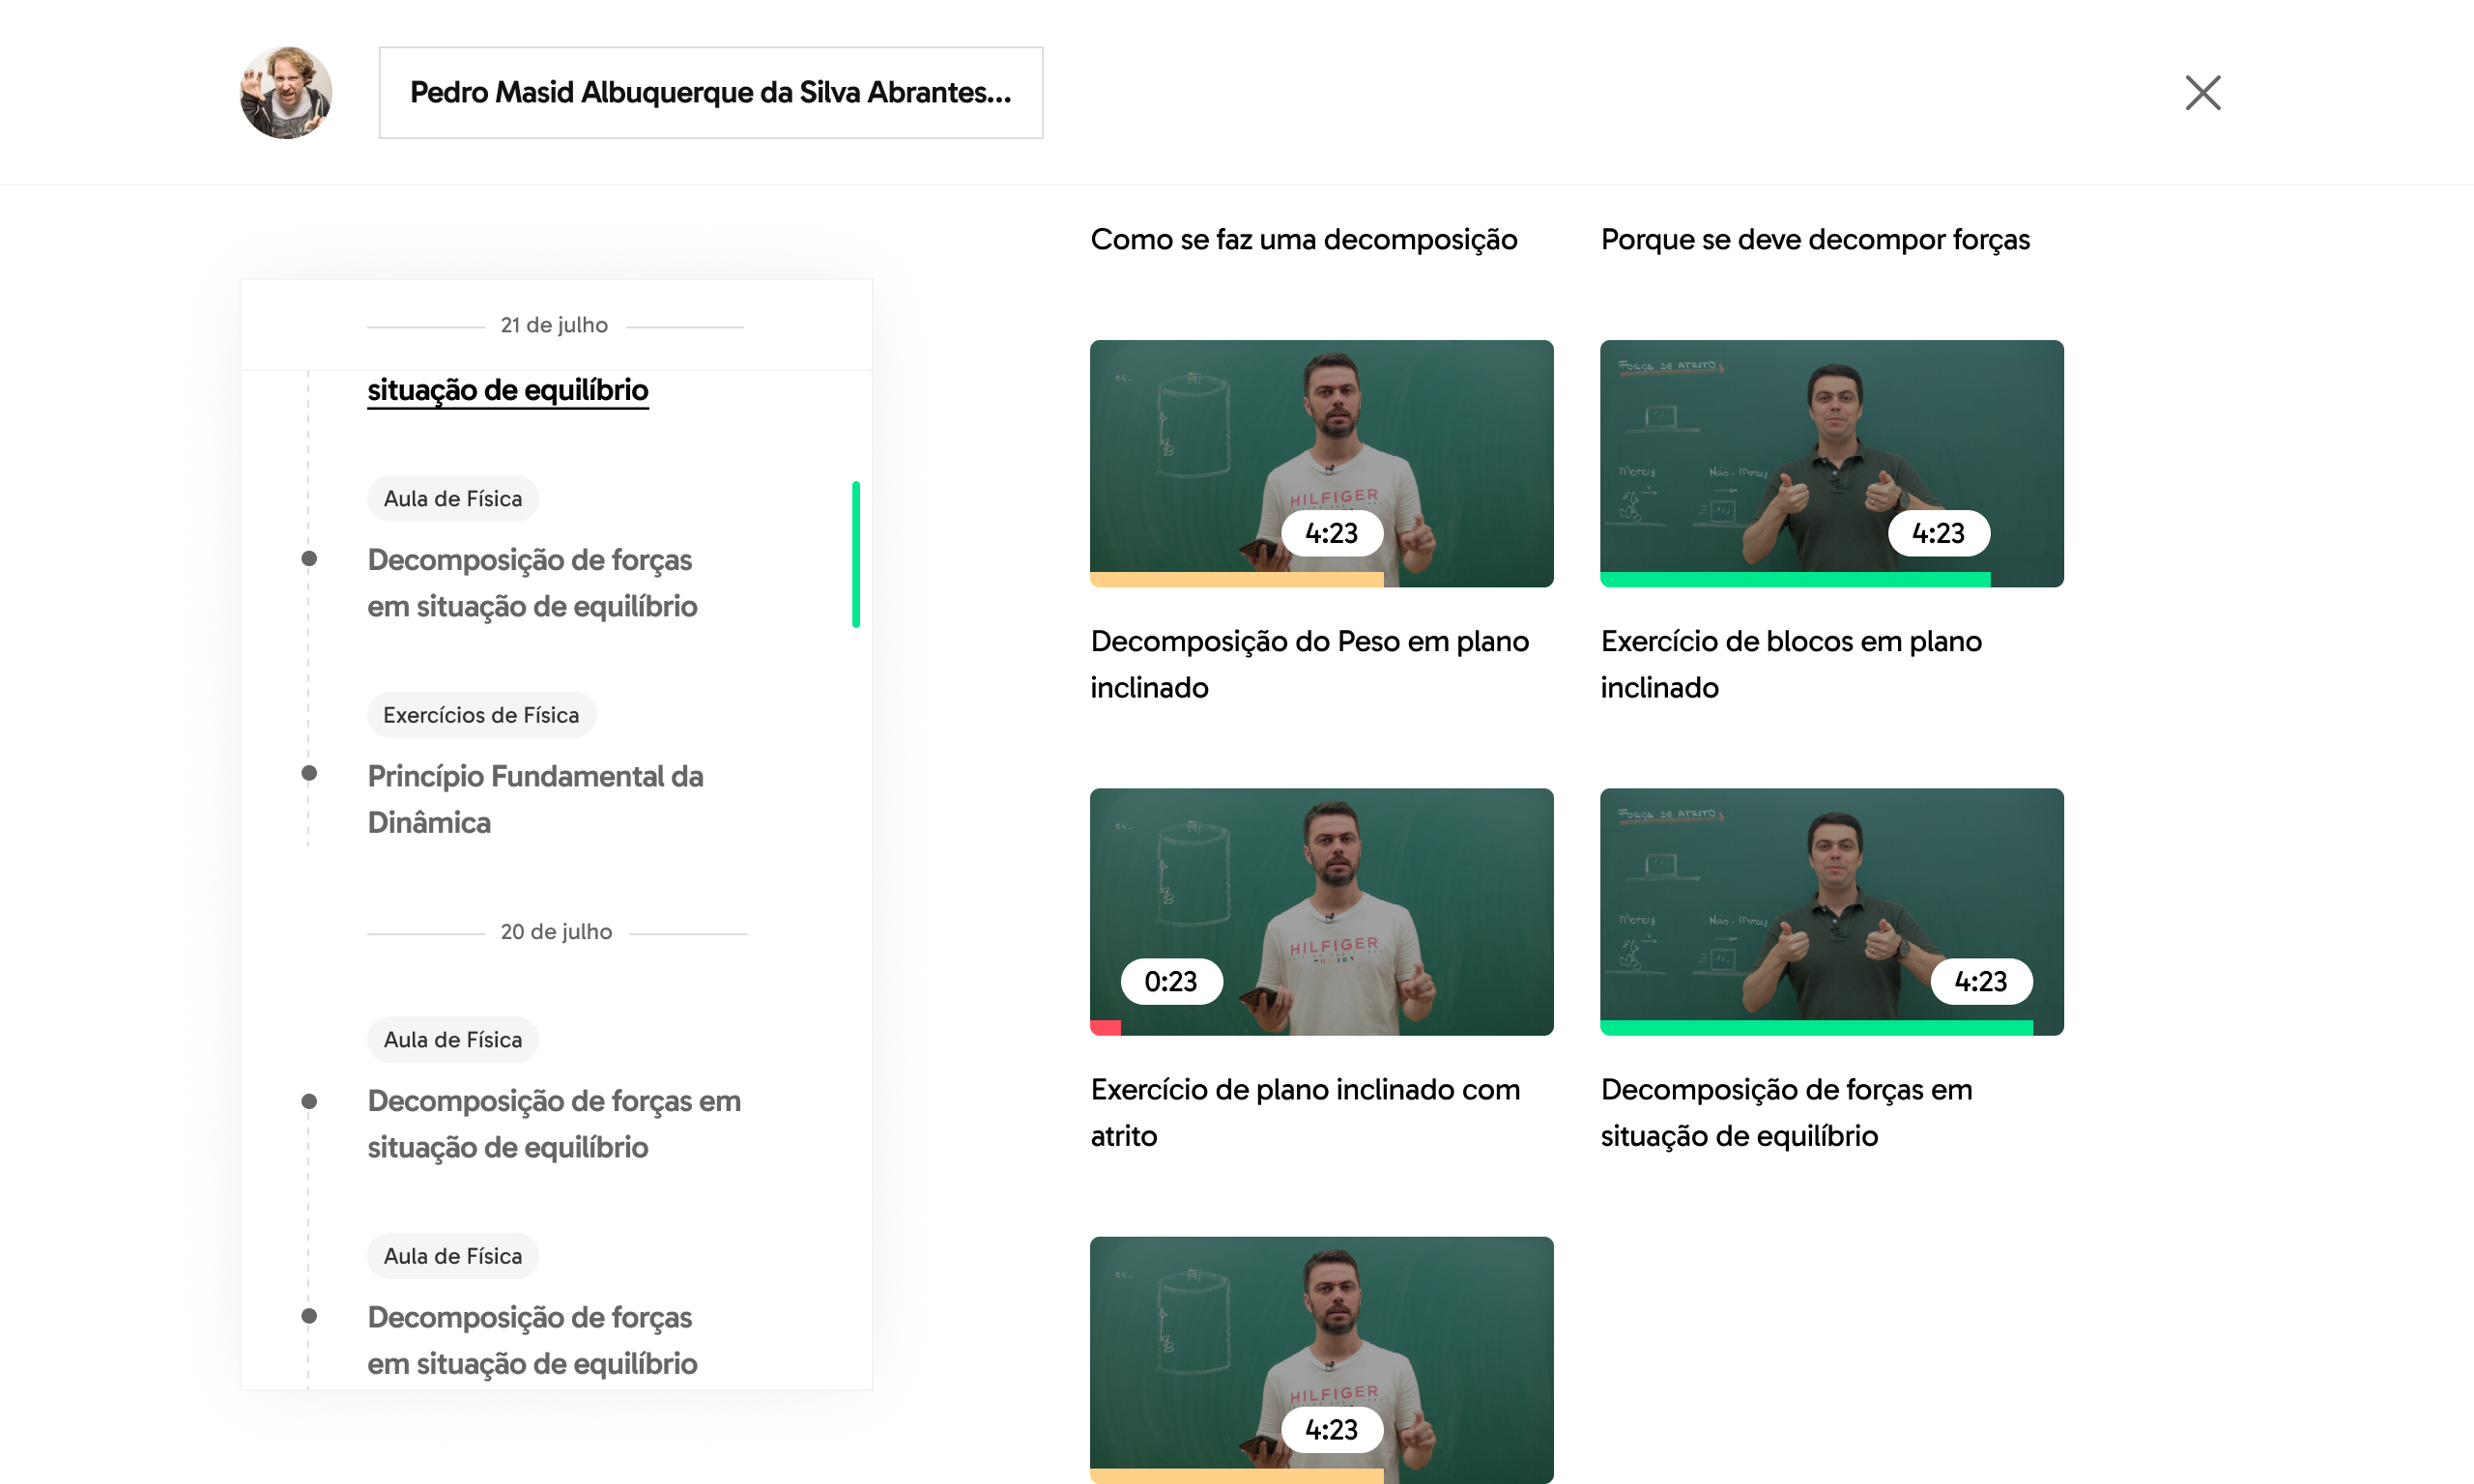
Detail page of a student exercise result
Detail page of a class activity
Student list
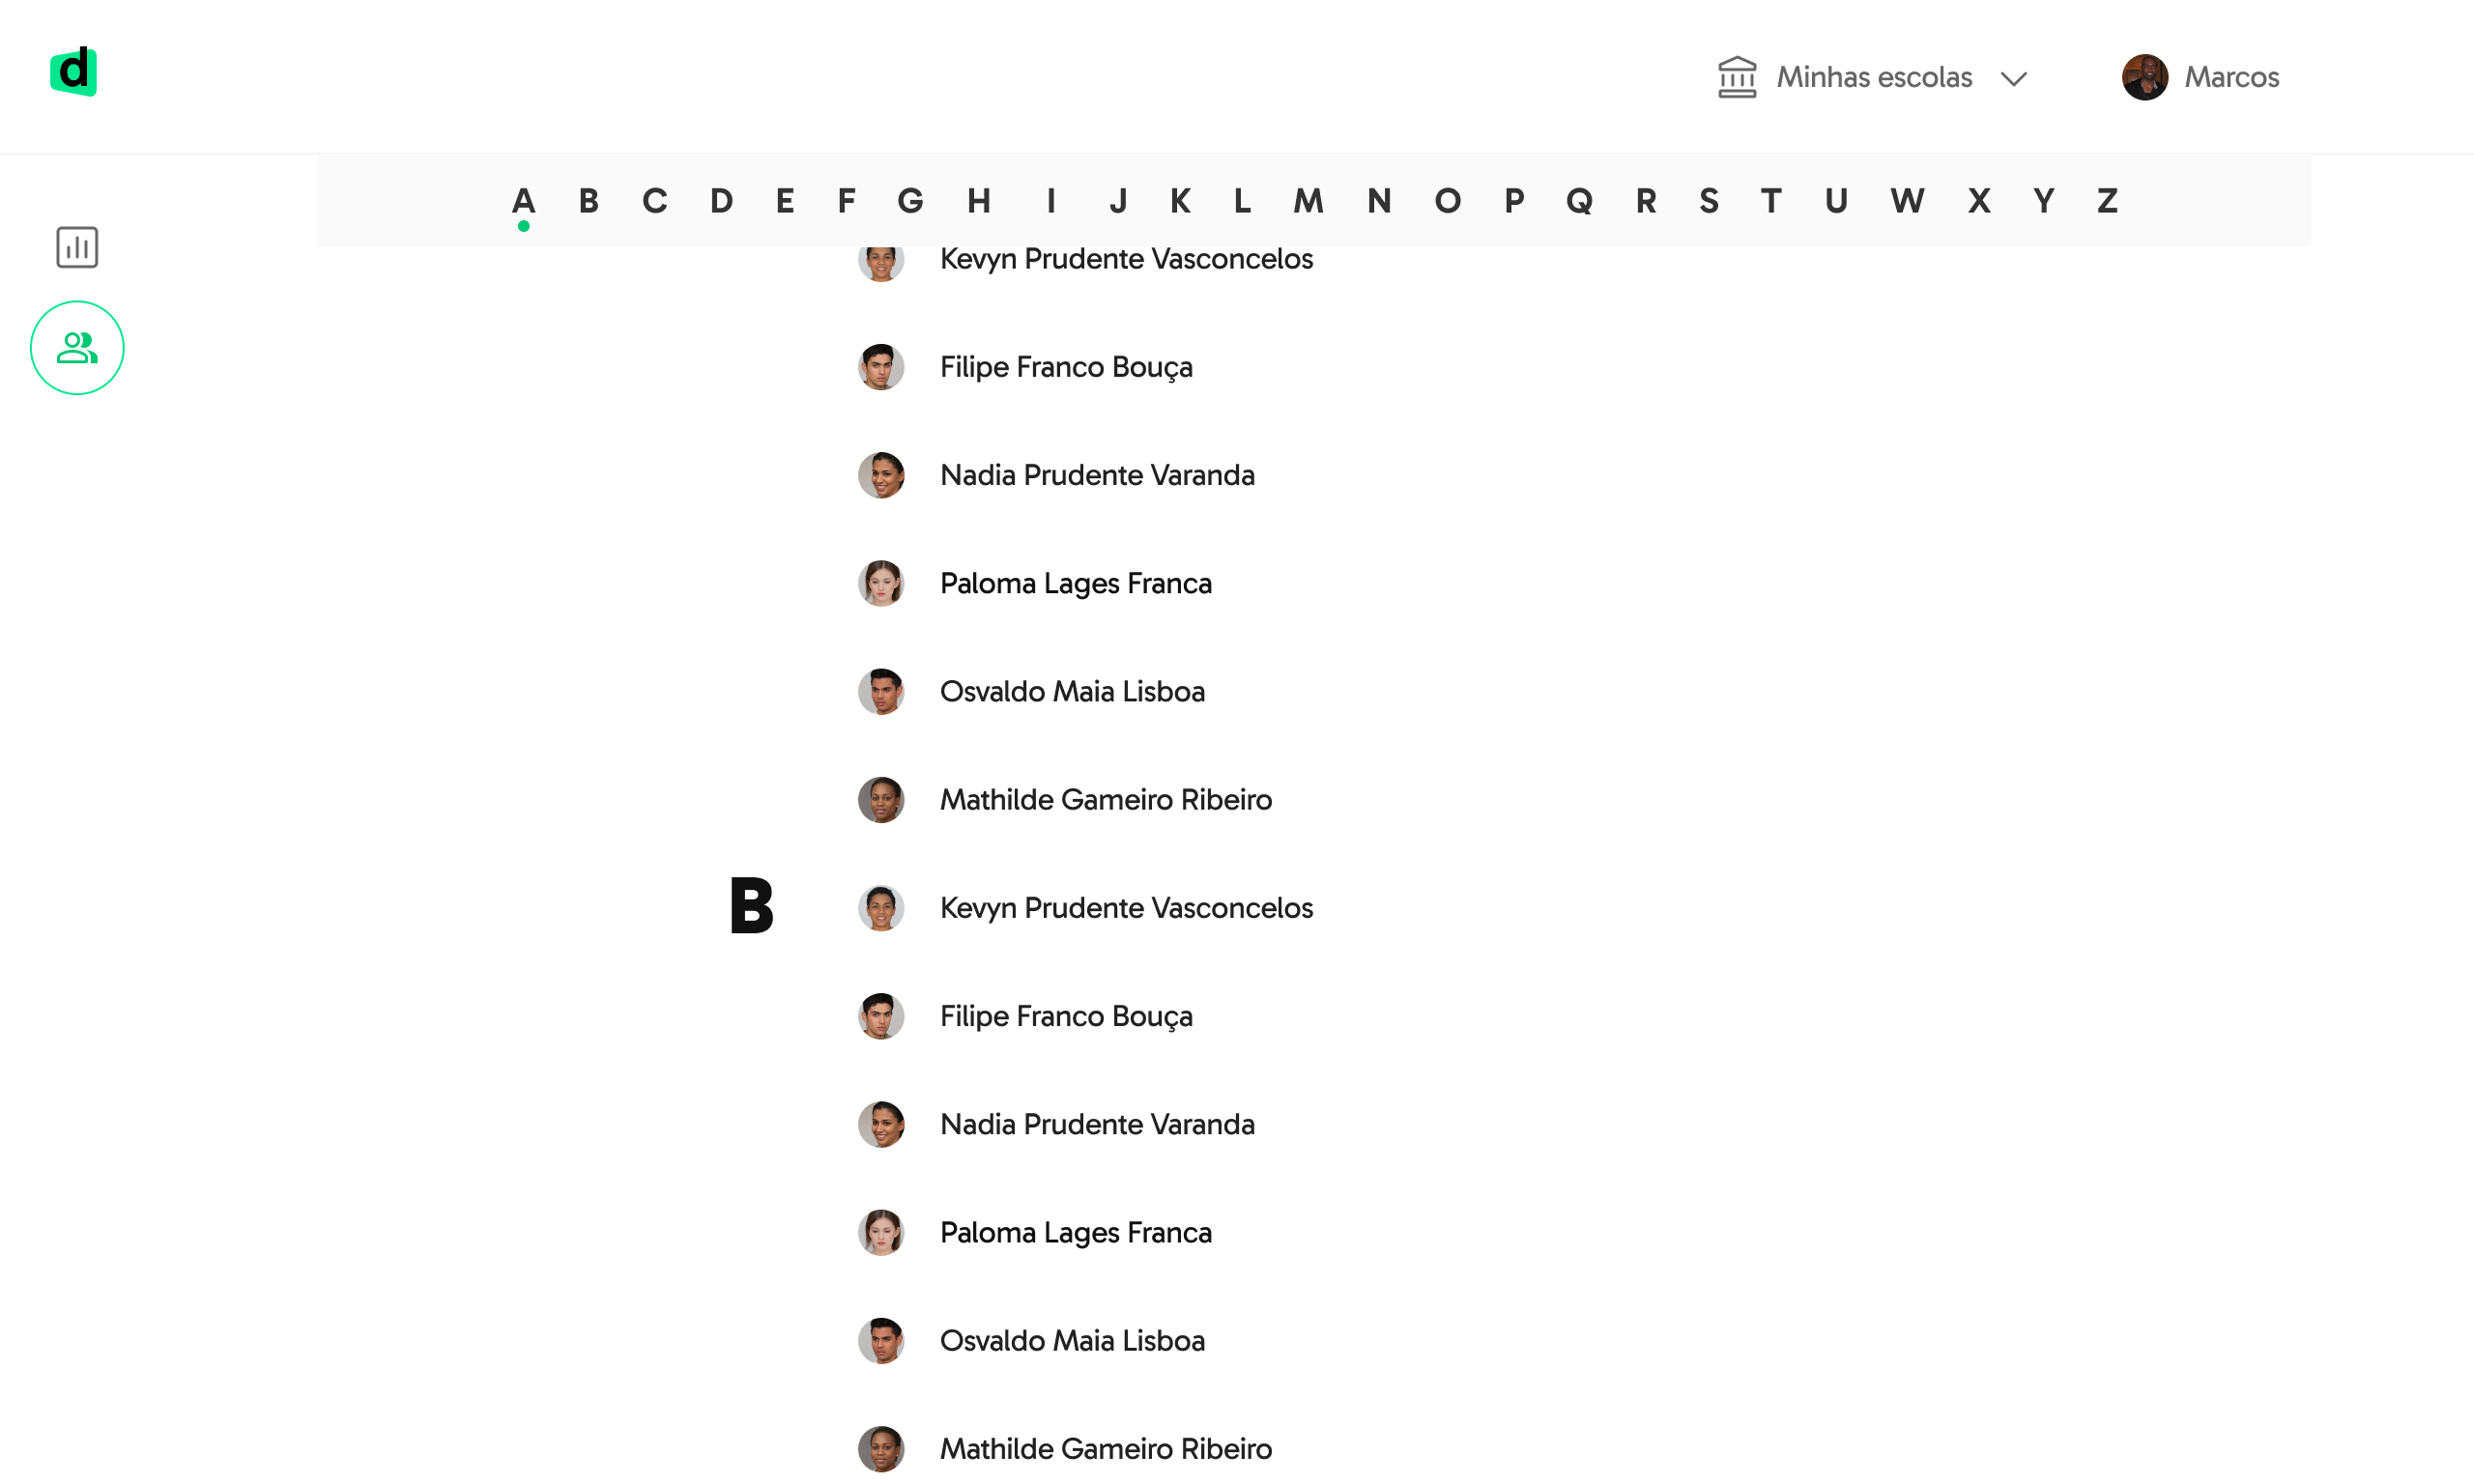
Student list after scroll
Usabillity testing
After designing the screens, I created a navigable prototype and, with the assistance of my Product Manager, we were able to schedule sessions with managers to test the new platform.
The tests were a success both in terms of usability and perceived usefulness, leaving everyone very eager to have the launch with them.
Some users wanted to see more specific data, such as: “What time did my student log in and how long did they stay online that day?”
Conclusion
The first release would be made only for desktop until we understood the need for mobile for this problem.
Unfortunately, I would no longer be present at Descomplica to iterate on these and other latent needs of a business unit as expansive as Descomplica para Escolas.
However, it was an incredibly valuable and insightful experience, particularly hearing the pointed feedback from institutions that were struggling with a platform that offered no support during such a challenging time as the Pandemic and in a setting as novel as remote High School education, alongside all the attendant difficulties.
